DNA extraction QC
DNA Quantity
Once you’ve got extracted and purified DNA, you need to know precisely how much material you have, since downstream protocols are optimized for a specific amount of DNA. Using a lot more or a lot less can impact the success of that process. A small aliquot of extracted DNA is generally used to assess the quality and quantity of the DNA obtained during extraction.
This information may be reported back to you by a sequencing center, and it often drives decisions about which samples qualify for which assays.
Quantitation results will usually be reported back as a concentration (ie, nanograms of DNA per microliter), or as the total mass/yield from the extraction (ie, nanograms or micrograms of DNA).
There are two main methods of quantitation that laboratories might use to report to you how much extracted DNA has been obtained:
- Spectrophotometry
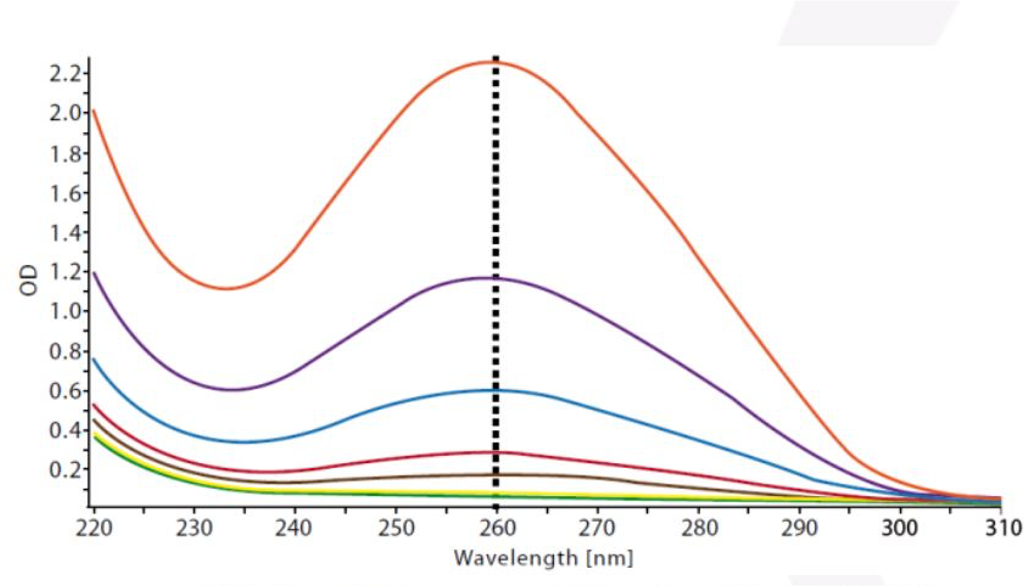
- Measures DNA quantity based on light absorbance at a wavelength of 260nm
- Can overestimate quantity due to other molecules absorbing at the same wavelength as DNA
- Also referred to as OD (optical density), Nanodrop (instrument)
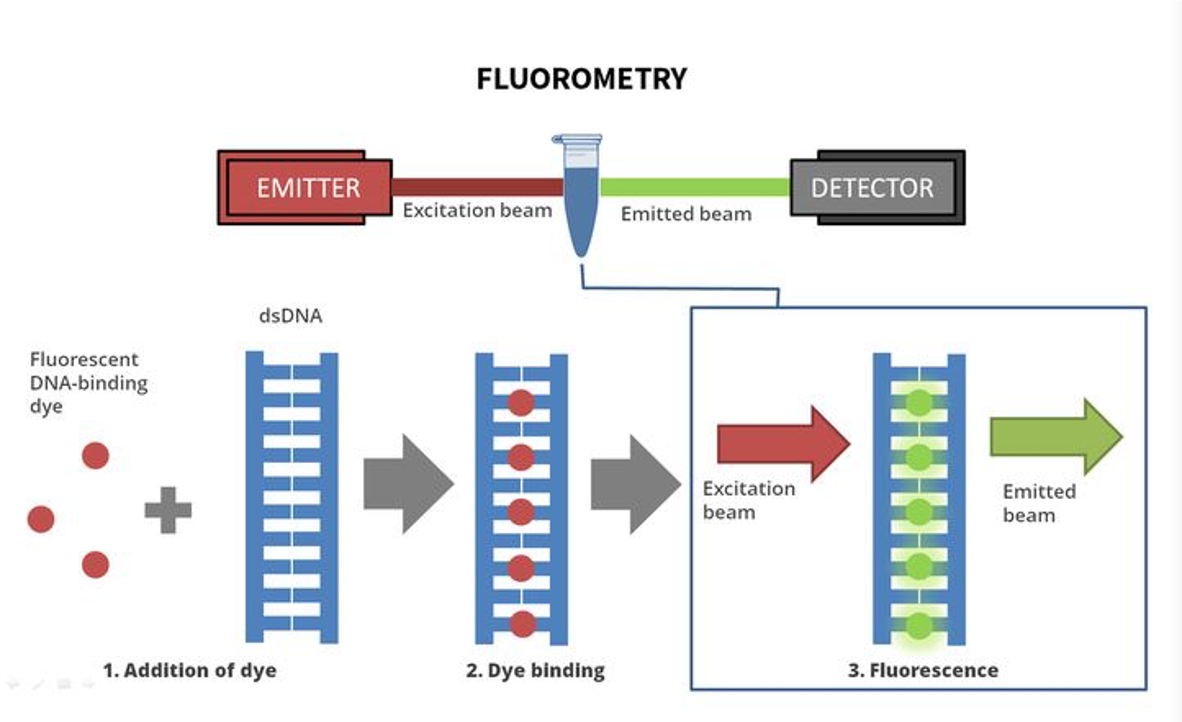
Both types of quantitation results can be useful, but many laboratories prefer fluorometry. If the lab doing the extraction reports back to you that you have 1000ng of DNA from a specimen, but that value was obtained using spectrophotometry, this number may not be accurate. The actual sequencing facility may find that there is actually substantially less material available for sequencing than expected.
DNA Quality
Generally, DNA quality refers to the length of the DNA fragments. After extraction procedures, DNA is generally not in full chromosome length strands; those strands end up breaking and being sheared by simple things like mixing and transferring steps. FFPE DNA often starts out (before extraction even) much more degraded.
There are two common methods that laboratories might use to report to you qualitative information about extracted DNA.
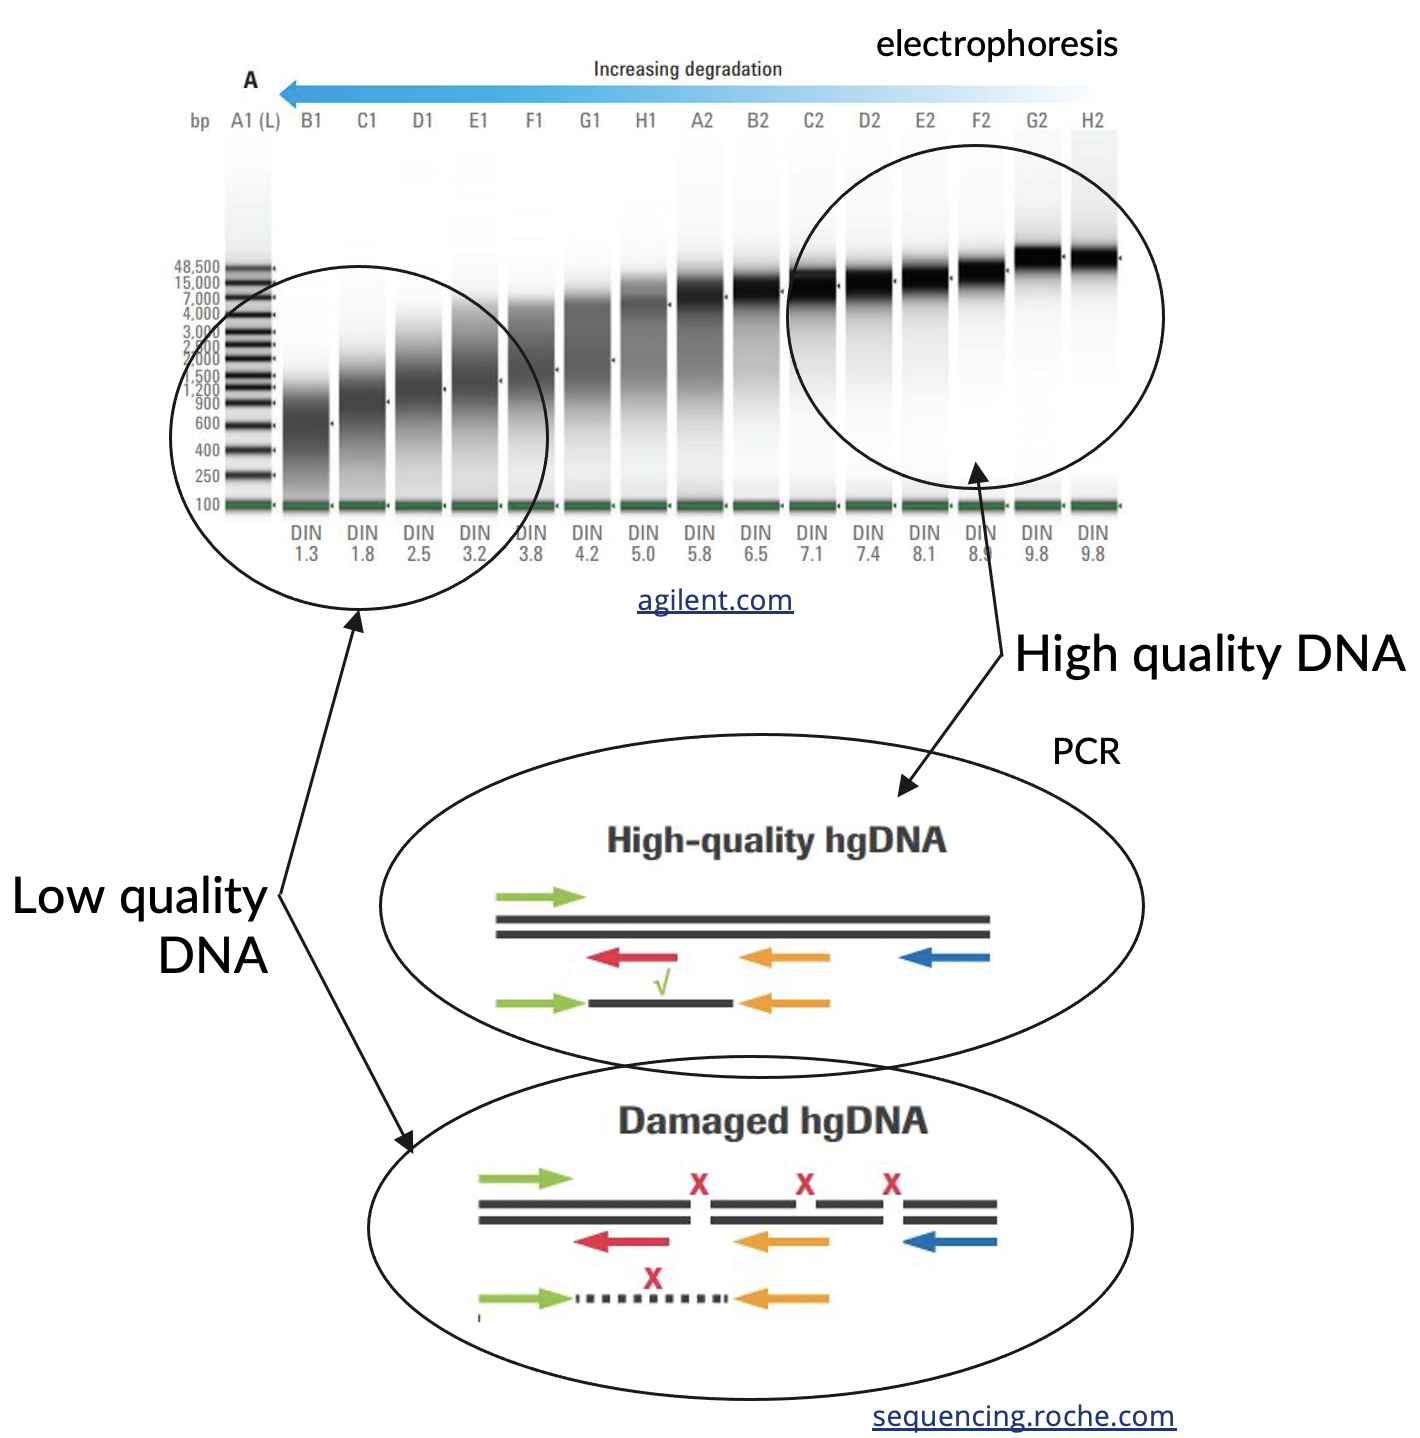
- Electrophoresis methods assess the size distribution of extracted DNA fragments when compared to a ladder with pieces of DNA of known sizes.
- PCR methods measure amplifiability of the DNA, where DNA is more difficult to amplify for lower quality DNA, especially as you try to use primer pairs that are farther apart from each other.
Both electrophoresis methods and PCR methods can be informative for helping to predict performance in NGS assays, or determine feasibility for a particular assay.
Sequencing Platforms
Illumina Sequencing
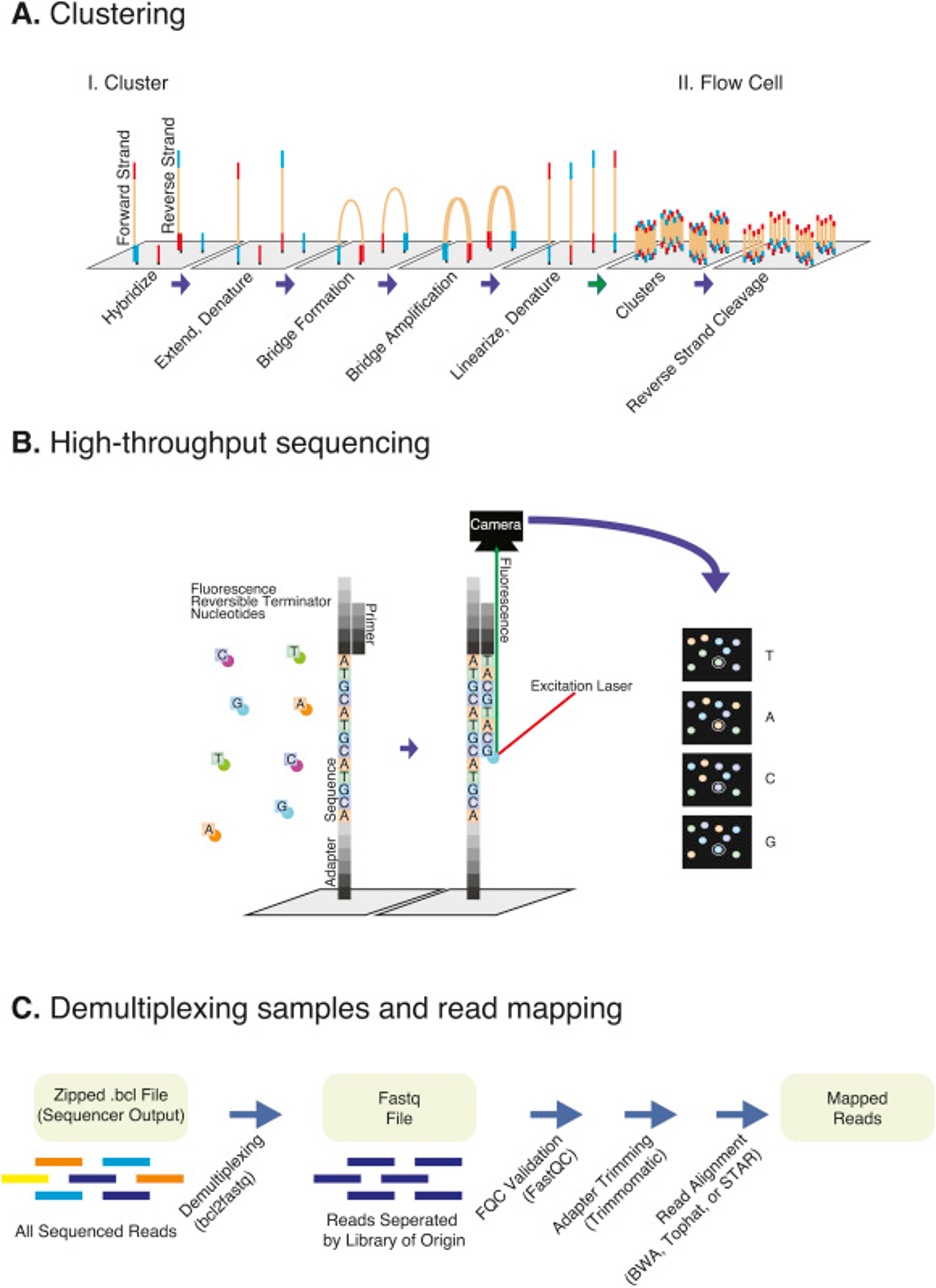
The process for Illumina sequencing is pictured below:
Library molecules are loaded onto flow cells and individual library molecules are clonally amplified into clusters via bridge amplification. Clusters are sequenced using a Sequencing By Synthesis (SBS) method using reversible terminator nucleotides that are fluorescently labeled. Fluorescence is captured in images for each cycle of sequencing, and the signal for each cluster is interpreted. Poor fluorescence or mixed fluorescent signals within a cluster will reduce base calling certainty and therefore sequence quality.
Ion Torrent
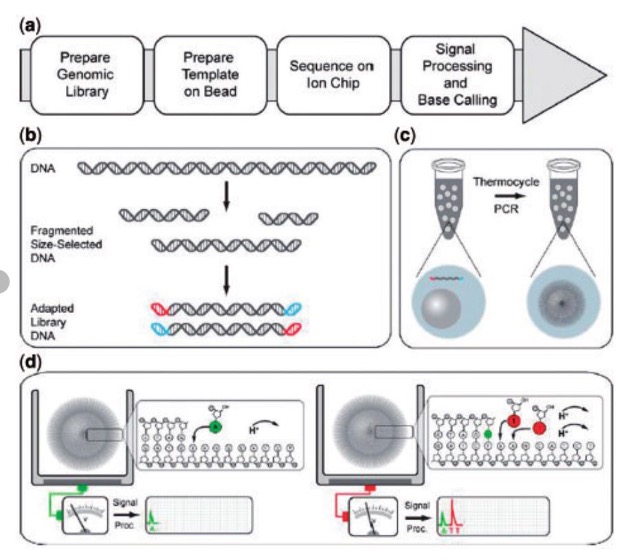
Library molecules undergo emulsion PCR on beads. After amplification, the emulsion is broken and the amplified beads are loaded into wells on the sequencing chip. Nucleotides are incorporated sequentially onto the chip; base incorporations for a given well/bead are interpreted as pH changes due to the release of Hydrogen.
Pacbio Long Read Sequencing
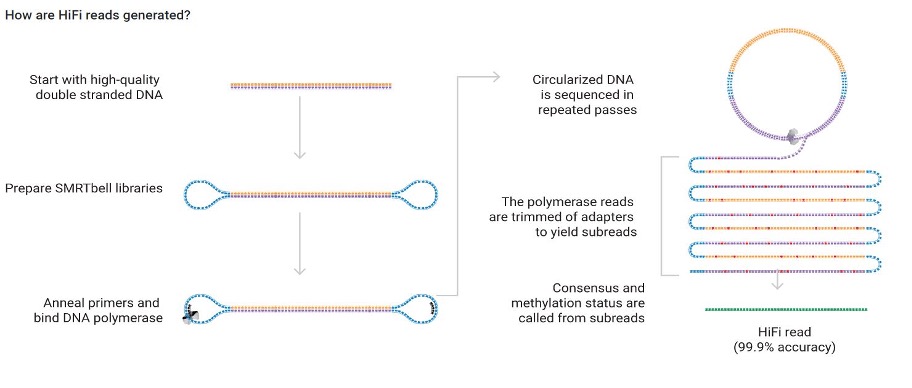
DNA Polymerase and sequencing primer are bound to the hairpin adapters on library molecules and loaded into wells (ZMWs) on a SMRTcell. Once the polymerase is activated, it unzips the library molecule into a circle as it incorporates nucleotides, which are fluorescently labeled. Nucleotide incorporation is captured in real time as a movie of fluorescent signals. Each individual molecule can be read through many times; these are analytically combined into a single HiFi (or CCS) read that is highly accurate.
Long read sequencing is great for repetitive regions, STR or AT/GC rich loci that are difficult to sequence or map with short reads, or where phasing across long regions is useful. Among long read platforms, Pacbio has the highest accuracy at 99.9%.
Oxford Nanopore Sequencing
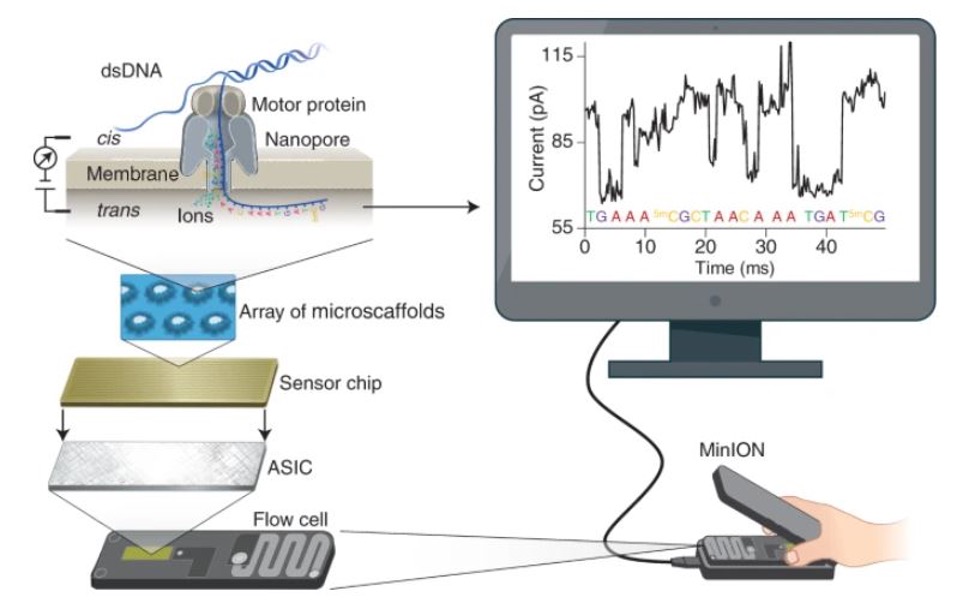
A motor protein unwinds dsDNA and drives single-stranded DNA (negatively charged) through the nanopore due to voltage applied across the membrane. As nucleotides pass through the nanopore, the current change is measured and used to determine nucleotides as they pass. Nanopore sequencing has the opportunity for the longest reads of any platform, albeit at lower accuracy than Pacbio.
Epigenomics
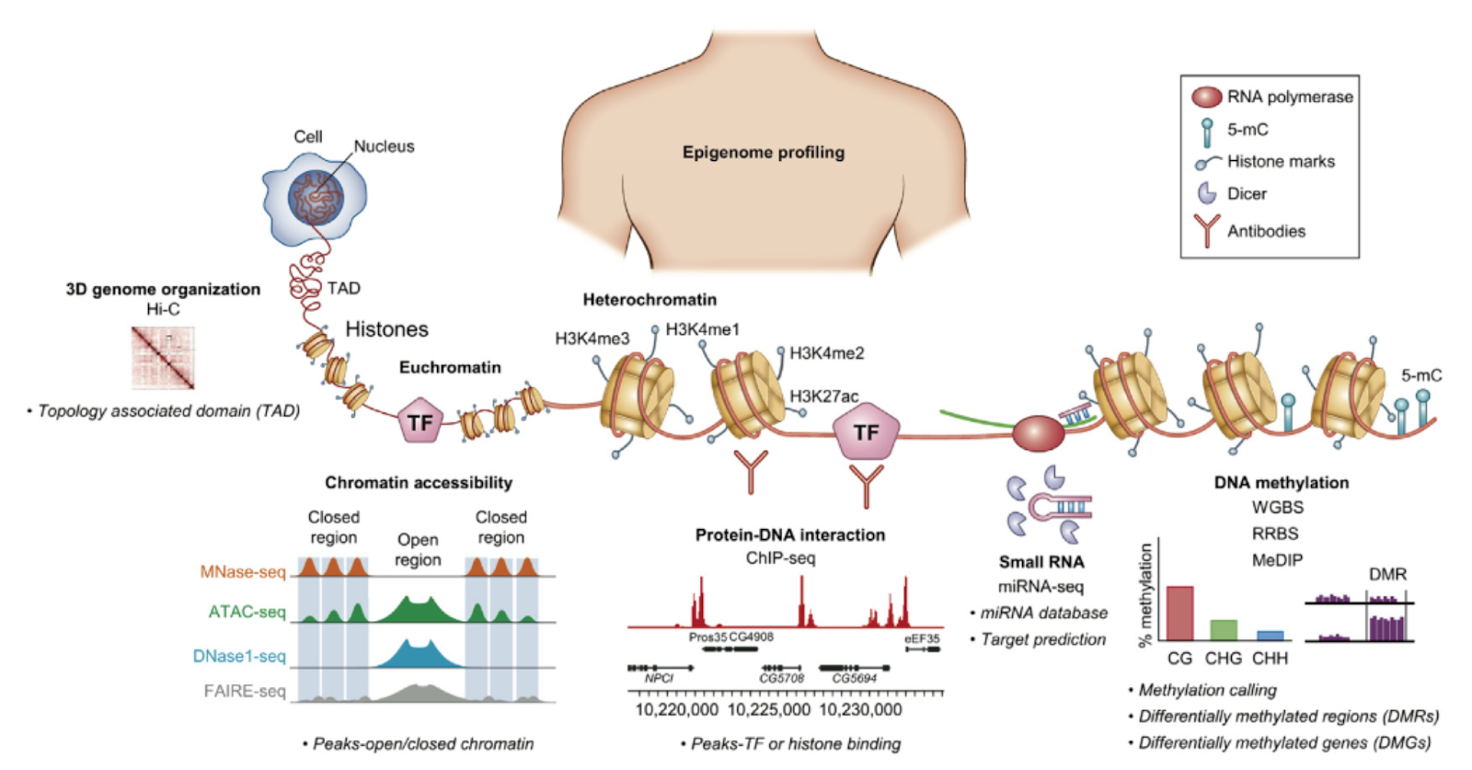
In addition to DNA-based and RNA-based bulk-sequencing, there are also epigenomic related bulk-sequencing techniques to explore the epigenome. Hi-C can be used to study the 3D genome organization and topology-associated domain. To examine chromatin accessibility (closed and open chromatin regions) a number of different approaches could be used such as MNase-seq, ATAC-seq, DNase-seq, FAIRE-seq. This is important to understand which genomic regions are transcriptionally active or repressed.
For protein-DNA interactions (e.g. the binding of specific transcription factors to DNA), ChIP-seq is particularly helpful. To study small RNA, miRNA-seq can be used. For DNA methylation, there are various approaches including Whole-Genome Bisulfite sequencing, Reduced Representation Bisulfite sequencing, and Methylated DNA immunoprecipitation.
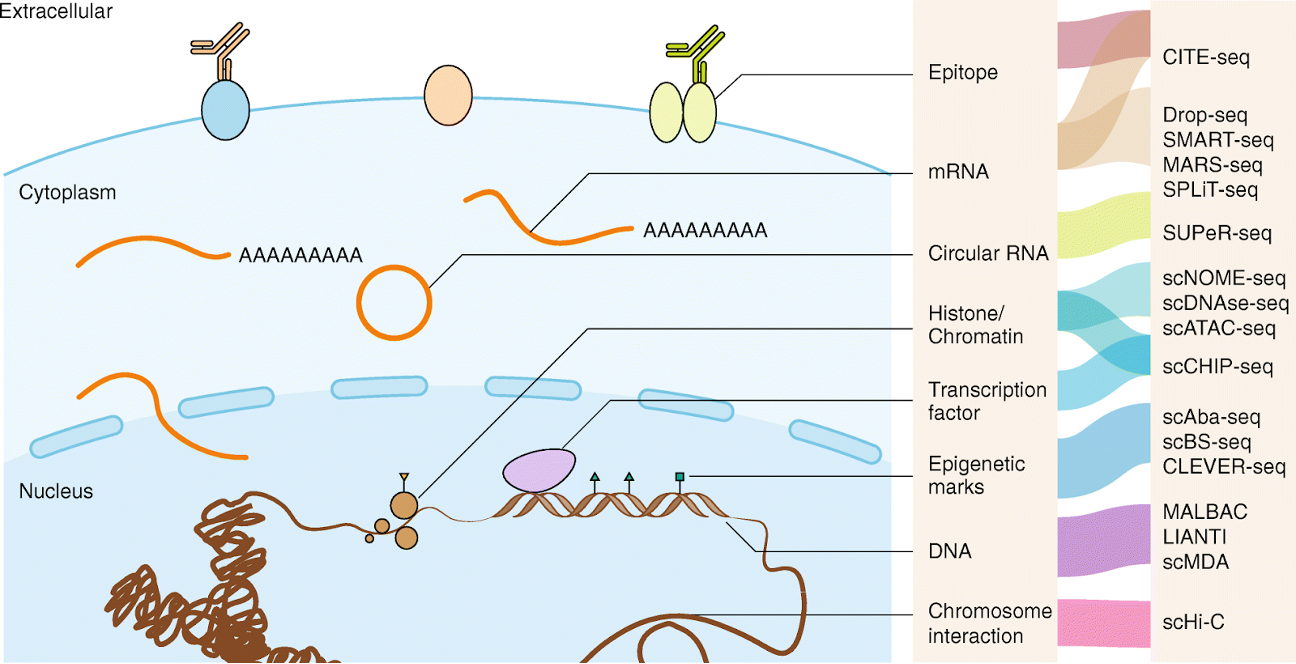
Single-cell methods
In recent years many new technologies have been developed to sequence at the individual cell level. We will not discuss these methods in this session, but see the figure below for a brief, non-comprehensive summary of single-cell methods:
