Presenters: Jian Sang, Alyssa Klein and Tongwu Zhang
Before we begin, please login to Biowulf and request an interactive session:
For a reminder on how to log-in to Biowulf, we refer you to this Biowulf HPC guide. In short:
- (Windows) use PuTTy
- (Mac) enter
ssh USERNAME@biowulf.nih.govto your terminal, then enter your password
Request an interactive session with the following command:
sinteractive --gres=lscratch:4 --mem=10g --cpus-per-task=4 --time=02:00:00
This session aims to provide a comprehensive guide to deciphering mutational signatures in cancer genomic studies. We will use the SigProfiler algorithm and published genomic data from a study of 21 breast cancers to demonstrate the key steps in the mutational signature workflow, including generating mutational profiles, extracting mutational signatures using the de-novo NMF approach, and decomposing mutational signatures based on known reference signatures (refitting).
We will also introduce several new mutational signature data portals, such as mSigPortal, Signal, and COSMIC, and show how to perform additional mutational signature analyses using these resources.
Finally, we will discuss advanced genomic analyses that can be conducted using mutational signature data.
To access the output results easily, we suggest mounting your Biowulf working directory on your local computer. If you need help with this, you can refer to the practical session in our first course (Locally Mounting HPC System Directories).
Cancer genomic dataset and bioinformatics tools
The dataset for today’s practical session is the whole genome sequencing data from the “Life History of 21 Breast Cancers” study, led by Dr. Nik-Zainal and colleagues at the Wellcome Trust Sanger Institute. This is a significant study in the field of cancer genomics, in which the researchers applied whole genome sequencing to 21 breast cancers with an average sequencing depth of 30-40X and analyzed somatic mutations and signatures to understand the life histories of these cancers. For today’s session, we will be using the cleaned mutation calling data from this study.
Bioinformatics tools
- SigProfilerMatrixGenerator: create mutational matrices for somatic mutations. This tool works to identify and categorize the mutations based on single nucleotide variants (SNVs), double base substitutions (DBSs), and insertions/deletions (IDs) and provides further transcriptional strand bias categorization.
- SigProfilerExtractor: de novo extraction of mutational signatures from somatic mutational data in a matrix or VCF format followed by decomposition analysis based on the provided reference signatures. The tool will generate the number of operative mutational signatures, mutational signature activities in each sample, and the probability of a mutation type assigned to a specific signature in a cancer genome.
- SigProfilerPlotting: Visualize various types of mutational patterns and mutational signatures in cancer genomes. This tool will be used to visualize all the mutational matrices generated by the SigProfilerMatrixGenerator as well as mutational signatures from the output of SigProfilerExtractor.
Note: For your convenience, these tools have been pre-installed in a Singularity container (to learn more, visit the Singularity documents).In short, a Singularity container is a file containing its own small operating system which allows developers to distribute a piece of software plus all of its dependencies in a self-contained computing environment. The purpose is to avoid the headache of trying to install something on your computer only to run into many errors and install many other softwares due to dependency issues/incompatibilities.
Mutational signature analysis workflow using SigProfilerMatrixGenerator and SigProfilerExtractor
1. Change the current working directory to /data/$USER/, where $USER is the current user’s username.
cd /data/$USER/
2. Create a new directory called practical_session_5 in the current working directory.
mkdir practical_session_5
3. Change the current working directory to practical_session_5.
cd practical_session_5
4. Copy the file session_5_sbatch.sh to the current working directory.
cp /data/classes/DCEG_Somatic_Workshop/Practical_session_5/session_5_sbatch.sh .
5. Submit the file session_5_sbatch.sh to the workload manager (e.g., SLURM) using the sbatch command.
Note: the –cpus-per-task, –mem, and –time flags are options that specify the number of CPU cores, amount of memory, and maximum runtime for the job, respectively.
sbatch --cpus-per-task=8 --mem=8g --time=3:00:00 session_5_sbatch.sh
6. The script will run for about 20 minutes. You can check the job running status using sjobs or squeue -u $USER.
To explore the expected results while the job is running, copy the result files from the expected result folders in your biowulf directory:
cp -r /data/classes/DCEG_Somatic_Workshop/Practical_session_5/Expect_result .
After mounting the HPC drive, users can check the expected result folder in their local system.
Mutational profile extraction with SigProfilerMatrixGenerator
7. Load singularity and set up the variables for the reference files and output directory.
module load singularity
PS5_Dir=/data/classes/DCEG_Somatic_Workshop/Practical_session_5
Output_Dir=/data/$USER/practical_session_5
8. Set up the extraction of the mutational profiles from the mutational callings for downstream signature analysis using singularity.
singularity exec \
--bind $PS5_Dir:/mnt,$Output_Dir:/output \
$PS5_Dir/Script/mut_sig.sif \
python3 /mnt/Script/mSigPortal_Profiler_Extraction.py \
-f tsv \
-i /mnt/BRCA21_SBS_mutations.txt \
-p BRCA21 \
-o /output/SigProfilerMatrixGenerator_output \
-g GRCh37 \
-t WGS \
-P True
To explain the command above:
- The singularity exec command is used to execute a Singularity container.
- The –bind flag is used to bind (or link) local directories to directories within the container so that programs within the container can access files on Biowulf. Here we link our input directory $PS5_Dir and output directory $Output_Dir to the directories /mnt and /output within the container, respectively.
- python3 is the command being run within the container
- mSigPortal_Profiler_Extraction.py is the script being passed as an argument to the python3 command.
- -f tsv specifies the output format as TSV
- -i specifies the input file
- -p BRCA21 specifies the cancer type
- -o specifies the output directory
- -g GRCh37 specifies the genome assembly
- -t specifies the sequencing type
- -P specifies whether to generate the visualization plots for mutational profiles in the output
9. Check the log file while running SigprofilerMatrixGenerator. You can find log output or error information session_5_job.out and session_5_job.err, respectively.
A21_SBS_mutations.txt
******* Your Input File is in TSV format. *******
There are 183916 items in the OutputFile: /output/SigProfilerMatrixGenerator_output/BRCA21_mSigPortal_SNV.txt
There are 0 items in the OutputFile: /output/SigProfilerMatrixGenerator_output/BRCA21_mSigPortal_INDEL.txt
The counts for each samples@filtration in OutputFile: /output/SigProfilerMatrixGenerator_output/BRCA21_mSigPortal_SNV.txt is as following:
PD4199a	6932
PD4005a	6104
PD3851a	1782
PD4116a	8026
PD4086a	2199
PD4194a	1484
PD4248a	2536
PD4120a	70690
PD4198a	4552
PD3904a	5608
PD3945a	10308
PD4107a	10291
PD3905a	4587
PD4192a	3919
PD4109a	9888
PD4103a	5360
PD4115a	9954
PD4085a	2673
PD3890a	6124
PD4006a	9194
PD4088a	1705
The counts for each samples@filtration in OutputFile: /output/SigProfilerMatrixGenerator_output/BRCA21_mSigPortal_INDEL.txt is as following:
True False
There is 0 line in input file: /output/SigProfilerMatrixGenerator_output/BRCA21_mSigPortal_INDEL.txt, will delete it!
Starting matrix generation for SNVs and DINUCs...

Completed! Elapsed time: 83.35 seconds.

Matrices generated for 21 samples with 0 errors. Total of 183915 SNVs, 969 DINUCs, and 0 INDELs were successfully analyzed.
10. Check the output from SigProfilerMatrixGenerator using the tree command:
tree /data/$USER/Expect_result/SigProfilerMatrixGenerator_output
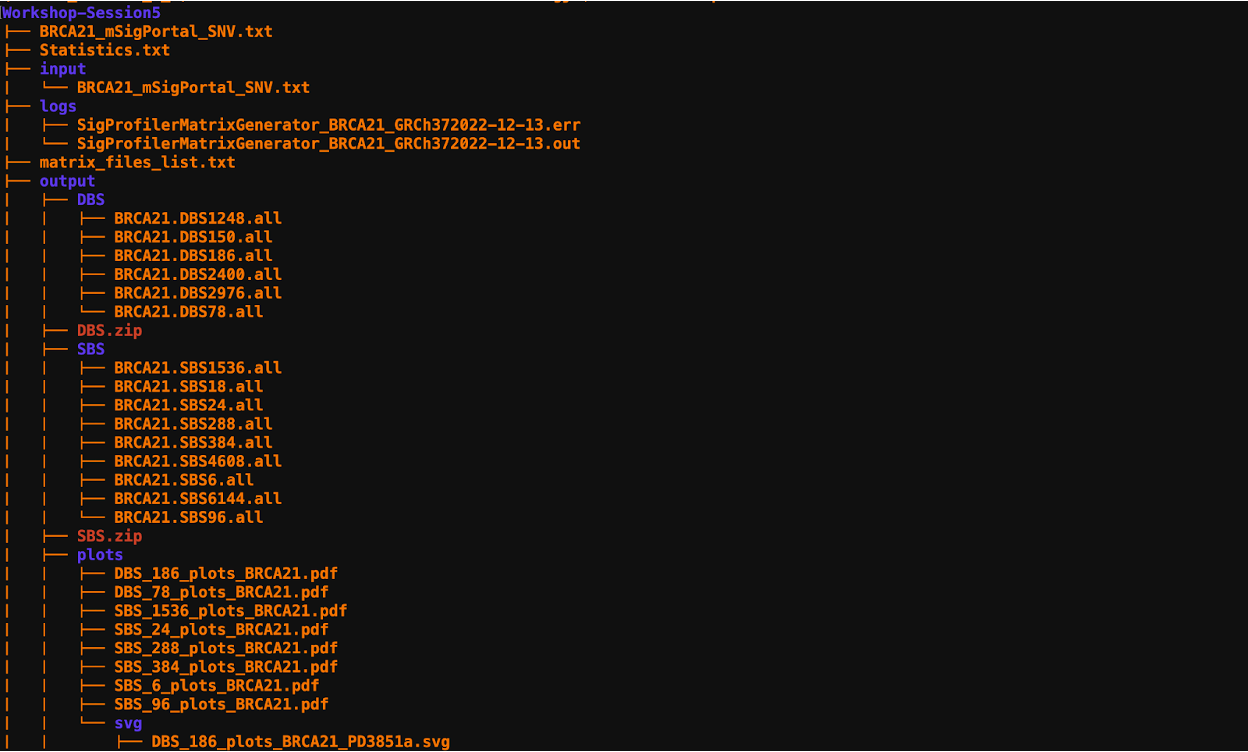
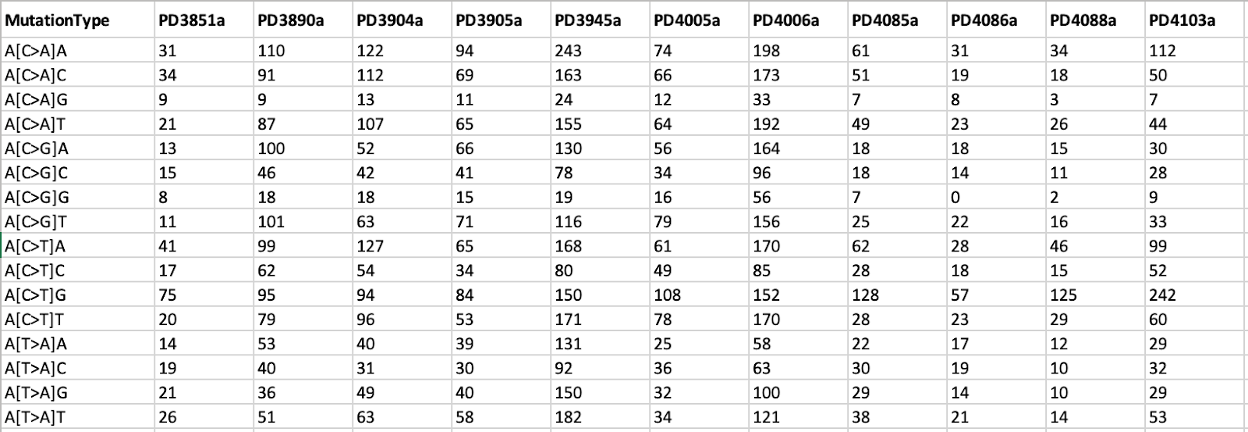
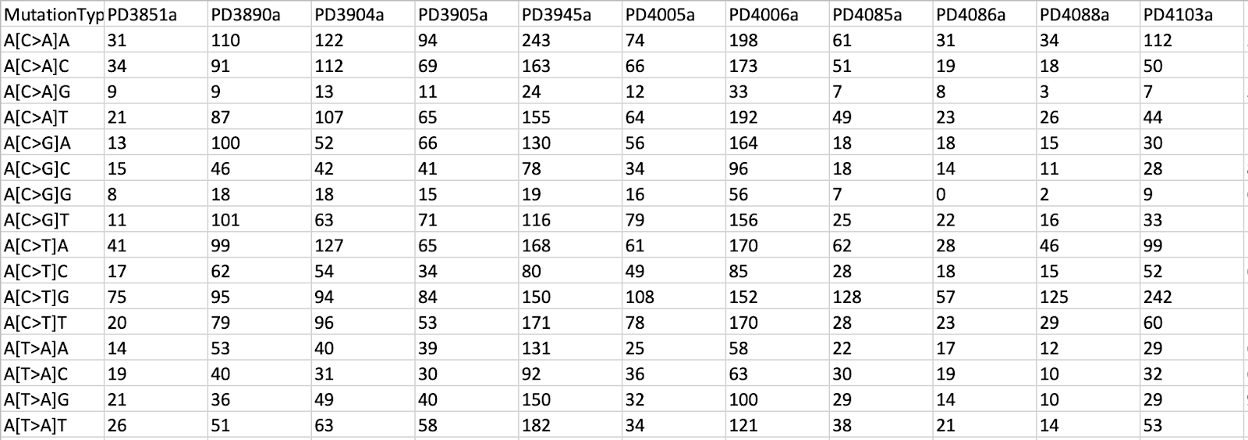
11. We will explore the SBS96 matrix file BRCA21.SBS96.all from the results.
less /data/$USER/Expect_result/SigProfilerMatrixGenerator_output/output/SBS/BRCA21.SBS96.all
You can find the visualization of all SBS96 mutational profiles at the following path:
/data/$USER/Expect_result/SigProfilerMatrixGenerator_output/output/plots/SBS_96_plots_BRCA21.pdf

Mutational signature de-novo analysis using SigProfilerExtractor
12. Perform mutational signature analysis based on SigProfilerExtractor and use COSMIC reference signature.
Use the following singularity exec command:
singularity exec \
--bind $PS5_Dir:/mnt,$Output_Dir:/output \
-B /dev/shm:/dev/shm $PS5_Dir/Script/mut_sig.sif /bin/sh \
-c "PATH=/mnt/Course_Session_5_2_2/bin:/usr/local/sbin:/usr/local/bin:/usr/sbin:/usr/bin:/sbin:/bin;  \
python3 /mnt/Script/mSigPortal_SigProfilerExtractor.py \
--input_type matrix \
--input_data /output/SigProfilerMatrixGenerator_output/output/SBS/BRCA21.SBS96.all \
--output /output/SigProfilerExtractor_output \
--reference_genome GRCh37 \
--signature_database /mnt/Reference_Signatures/GRCh37/COSMIC_v3.1_SBS_GRCh37.txt \
--minimum_signatures 1 \
--maximum_signatures 6 \
--min_nmf_iterations 100 \
--max_nmf_iterations 1000 \
--nmf_test_conv 2 \
--context_type SBS96 \
--nmf_replicates 10"
This command is using the singularity exec command to execute a container located at $PS5_Dir/Script/mut_sig.sif. Here is an explanation of each of the flags used in the command above:
- –bind flag is being used to specify directories that should be mounted within the container. $PS5_Dir is being mounted at /mnt and $Output_Dir is being mounted at /output.
- -B flag is being used to bind the /dev/shm directory in the host system to /dev/shm in the container.
- /bin/sh -c flag specifies that a shell command should be run within the container, followed by a string containing the command to run. This command sets the PATH environment variable and then runs the python3 command to execute a Python script located at /mnt/Script/mSigPortal_SigProfilerExtractor.py. This script is being passed a number of flags that specify various options for its execution:
- –input_type flag specifies that the input data for the script is in the form of a matrix. The –input_data flag specifies the location of this input data within the container, which is mounted at /output/SigProfilerMatrixGenerator_output/output/SBS/BRCA21.SBS96.all in the host system.
- –output flag specifies the location where the script should write its output, which is mounted at /output/SigProfilerExtractor_output in the host system.
- –reference_genome flag specifies that the reference genome to be used is GRCh37
- –signature_database flag specifies the location of a signature database within the container, which is mounted at /mnt/Reference_Signatures/GRCh37/COSMIC_v3.1_SBS_GRCh37.txt in the host system.
- –minimum_signatures and –maximum_signatures flags specify the minimum and the maximum number of signatures that the script should extract, respectively
- –min_nmf_iterations and –max_nmf_iterations flags specify the minimum and maximum number of iterations that should be used in the non-negative matrix factorization (NMF) algorithm
- –nmf_test_conv flag specifies the test convergence value for the NMF algorithm
- –context_type flag specifies the context type to be used as SBS96
- –nmf_replicates flag specifies the number of NMF replicates to be used.
Note: In this command, we have only included the most important parameters. The NMF algorithm is computationally intensive and can take a significant amount of time to run on the Biowulf HPC. To speed up the process, we have modified the value of several parameters to a smaller number to speed things up (e.g. nmf_iterations set to 100-1000). You can customize the parameters based on your specific project needs. For more information on these parameters, see this link.
During the execution of SigProfilerExtractor, you may see the following messages:

13. Check the output of SigProfilerExtractor. Because of time constraints, here we have only provided a brief overview of the main directories. For a complete description of all output, please refer to the official documentation.
ls /data/$USER/Expect_result/SigProfilerExtractor_output

- JOB_METADATA.txt contains metadata about this job, including: operating system, Python and Package Versions, Analysis Progress and Job Status.
- Seeds.txt contains an ID which is used to initialize a random number generator for simulation. Using the same seed for a process ensures the
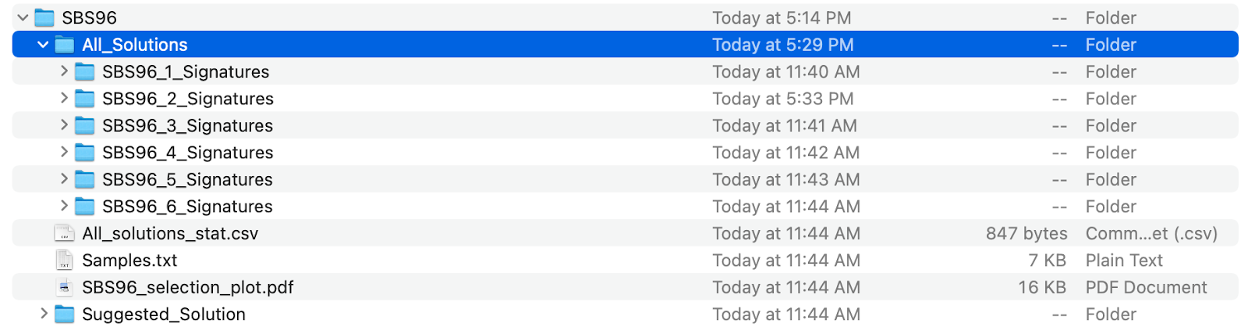
- subdirectory SBS96 is the major output of specific mutational context extracted by SigProfilerExtractor, including:
- All_Solutions subdirectory
- Suggested_Solution subdirectory
- All_solutions_stat.csv
- SBS96_selection_plot.pdf
- Samples.txt
Subdirectory SBS96/All_Solutions contains the results from running extractions at each rank within the range of the input maximum signature numbers. As our maximum_signatures is 6, there are six subdirectories, beginning with SBS96_1_Signatures to SBS96_6_Signatures.
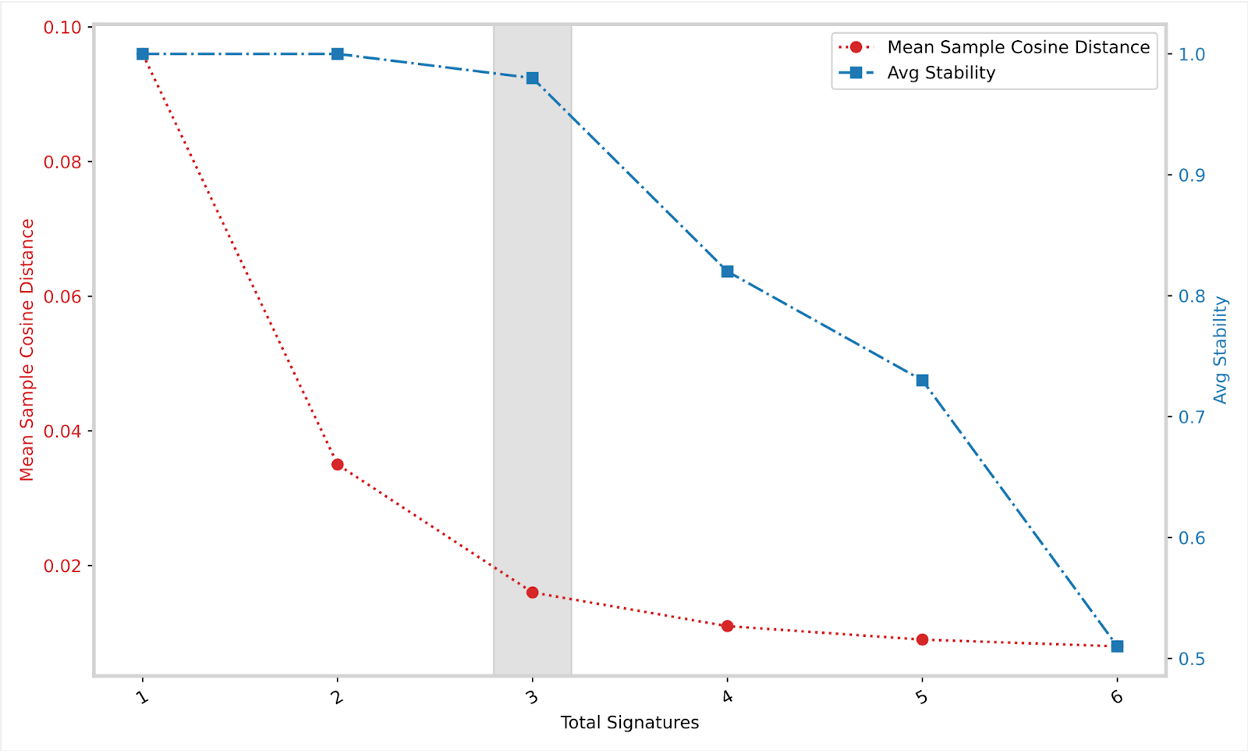
SBS96/SBS96_selection_plot.pdf contains a plot between the mean sample cosine distance and the average stability. The gray bar indicates the optimal number of signatures selected by SigProfilerExtractor.
SBS96/Samples.txt contains the number of mutations found in each of the samples corresponding to each mutational context.
Subdirectory SBS96/Suggested_Solution subdirectory contains the optimal solution, also the result we need. Let’s go to the subdirectory SBS96_De_Novo_Solution.
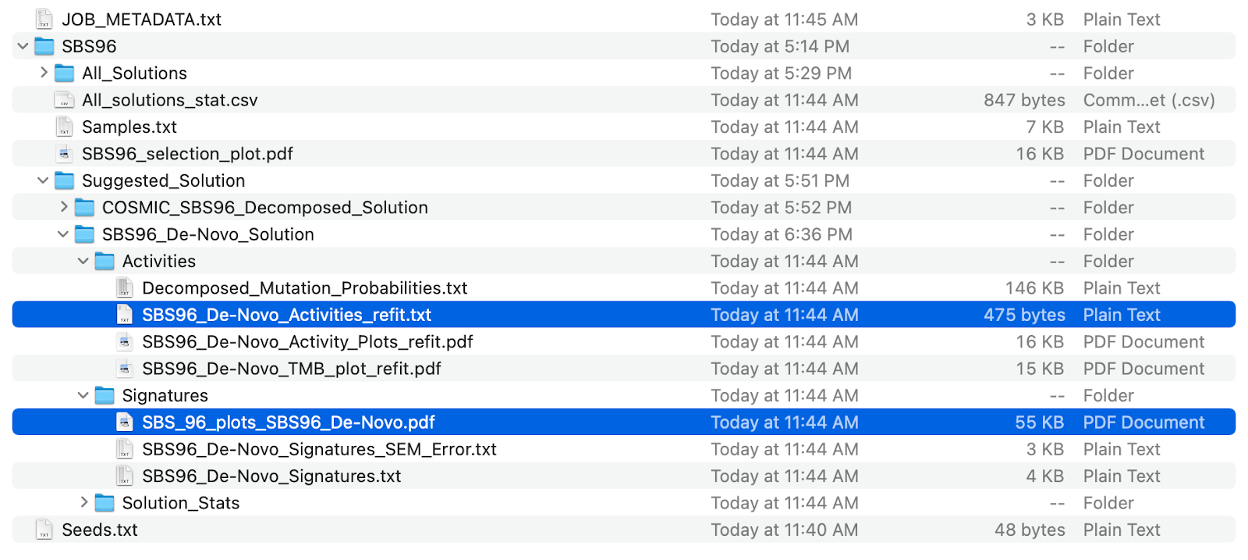
cd /data/$USER/Expect_result/SigProfilerExtractor_output/SBS96/Suggested_Solution/
tree SBS96_De-Novo_Solution/
You can download the file SBS96_De-Novo_Activities_refit.txt and SBS_96_plots_SBS96_De-Novo.pdf to your local computer. Open SBS96_De-Novo_Activities_refit.txt with excel.
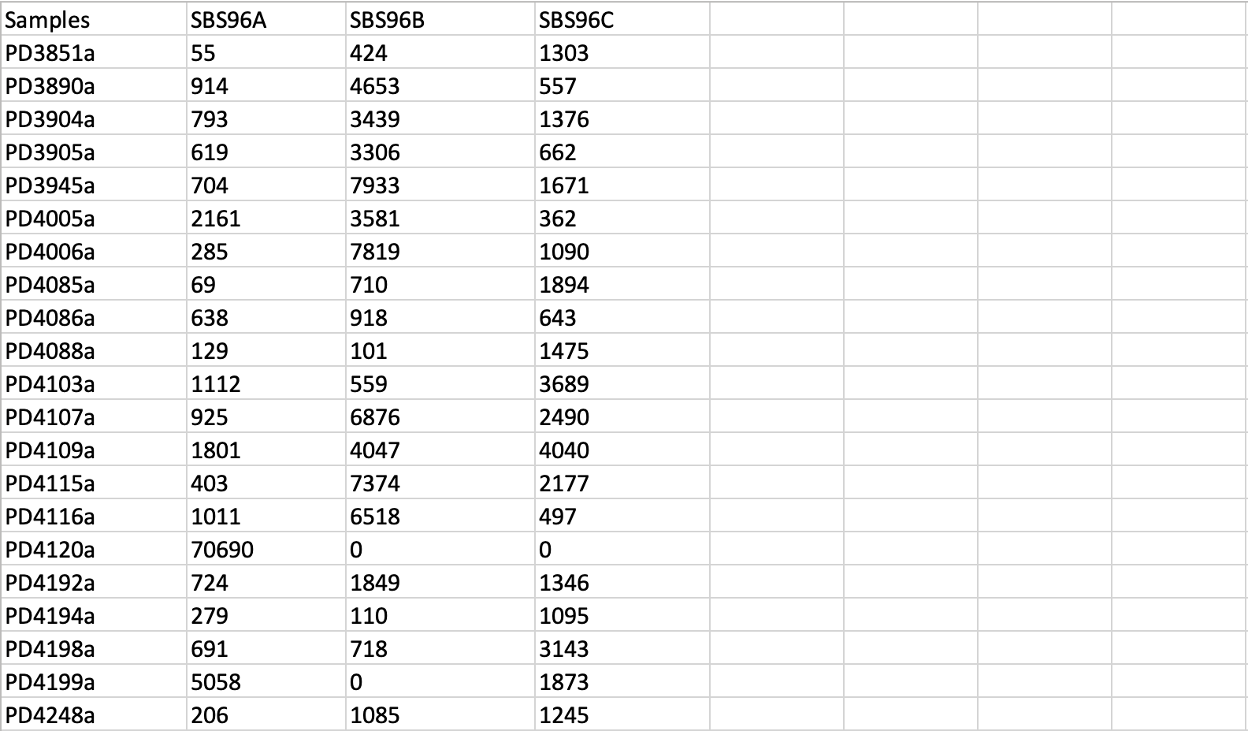
We can see that three de novo signatures (SBS96A, SBS96B, and SBS96C) were extracted from the input mutational matrix. The first column is the sample ID, and the numbers in the remaining columns represent the counts of each de novo extracted signature found in each sample.
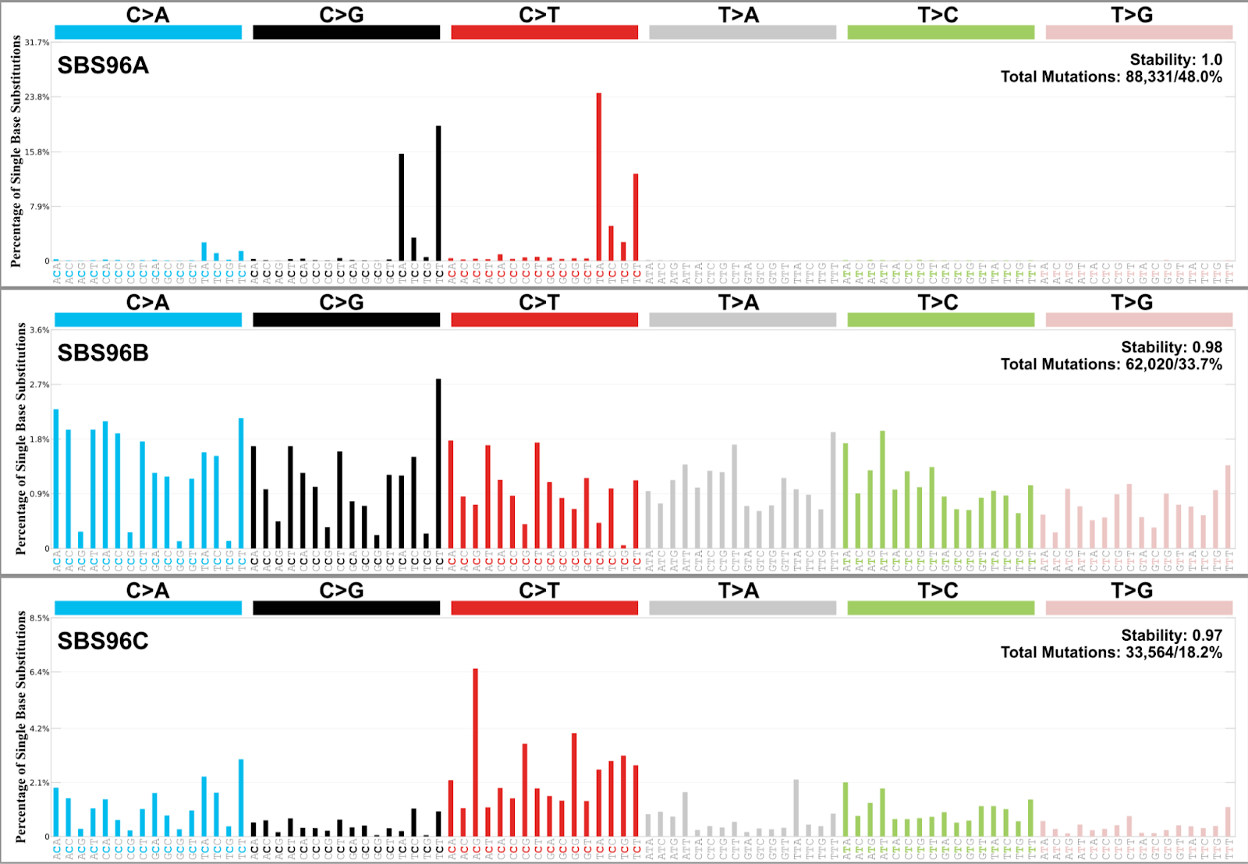
Open SBS_96_plots_SBS96_De-Novo.pdf, in which you can find the context of different signatures.
De novo signature decomposition using COSMIC signatures
14. Check the results of the mutational signature decomposition as highlighted in blue in the following screenshot.
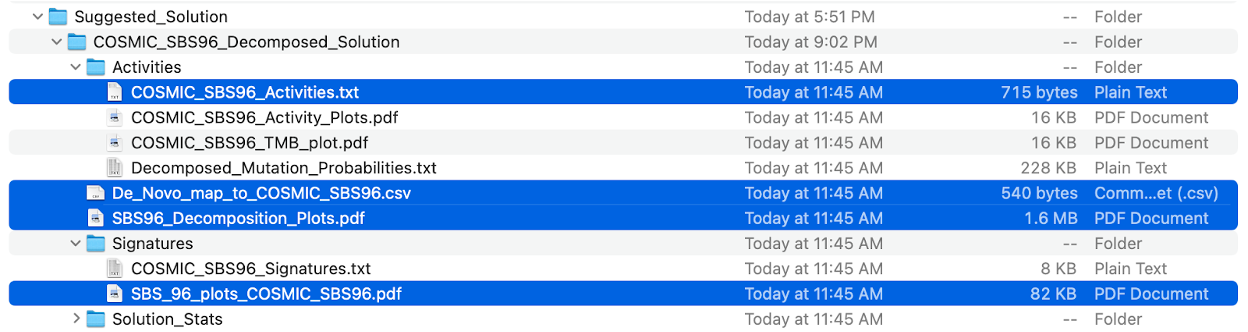
De_Novo_map_to_COSMIC_SBS96.csv contains data on how the de novo extracted signatures are decomposed using the COSMIC reference signatures. Additionally, it also contains information on the L1 error %, L2 error %, KL divergence, cosine similarity, and correlation of this decomposition.

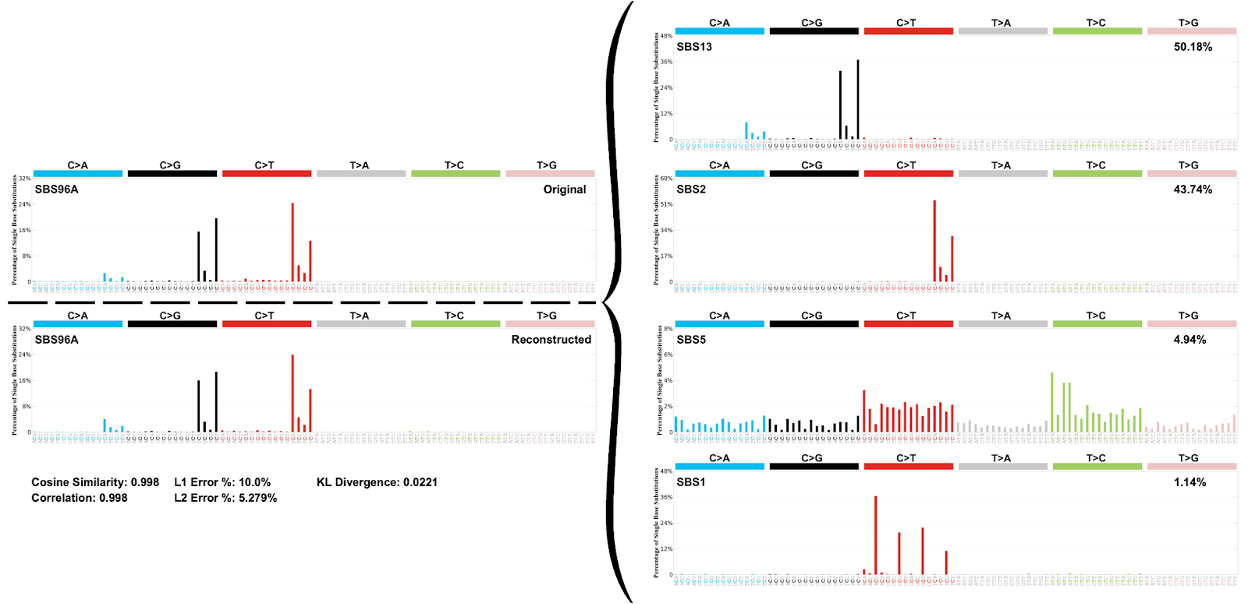
SBS96_Decomposition_Plots.pdf There are two plots to the left of the curly brace. One is the original de novo signature plot and the other is the reconstruction of the de novo signature. On the right side of the curly brace are the COSMIC signatures that the de novo signature is decomposed. Additionally, below the reconstructed plot are the data for cosine similarity, correlation, L1 error %, L2 error %, and KL divergence of the decomposition.
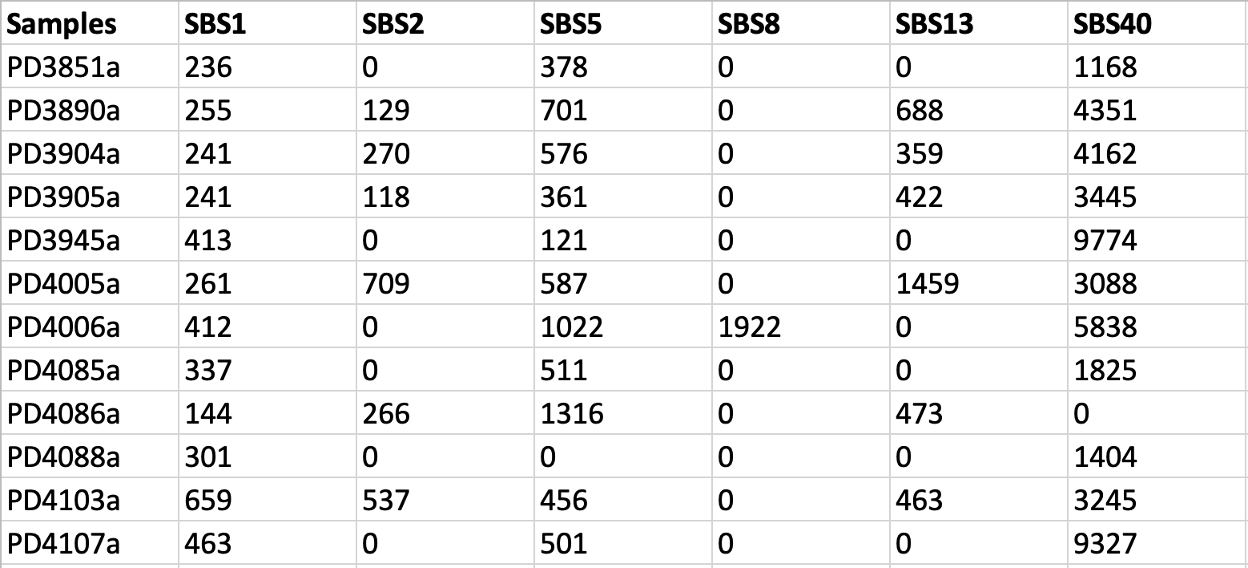
Let’s open the file COSMIC_SBS96_Activities.txt with Excel. We find that six COSMIC signatures were included from signature activity matrix, including the famous APOBEC signatures SBS2 and SBS13.
SBS_96_plots_COSMIC_SBS96.pdf, in which you can find the visualizations of these COSMIC reference signatures.

Explore mutational signatures data portals (mSigPortal, Signal, COSMIC)
One of the data portals we will highlight today is mSigPortal. mSigPortal is a platform for exploring, visualizing, and analyzing mutational signatures and related data. It is currently in development, but a stable beta version is available for testing through the NIH network at the following link: https://analysistools-qa.cancer.gov/mutational-signatures. The final production version will be made available online at https://analysistools.cancer.gov/mutational-signatures in the future.
Explore the known etiology of mutational signatures (mSigPortal Catalog)
In this demonstration, we will use mSigPortal to explore various mutational signatures and their known etiologies. The current version of the mSigPortal Catalog contains 3,247 mutational signatures collected from literature sources and covers a variety of mutational profiles, such as single base substitutions (SBS), double base substitutions (DBS), small insertions and deletions (ID), copy number (CN), and rearrangements (RS). These signatures have been organized into different categories based on their source and studies. The interactive single-page design allows you to easily find and explore any signature of interest.
Let’s begin exploring the mSigPortal Catalog module:
15. Click the following link to take you to the mSigPortal development website home page: https://analysistools-qa.cancer.gov/mutational-signatures.
16. From the home page, click on the Catalog tab, just to the right of the Home tab.

17. After clicking the Catalog tab, you will see a screen that looks like this:
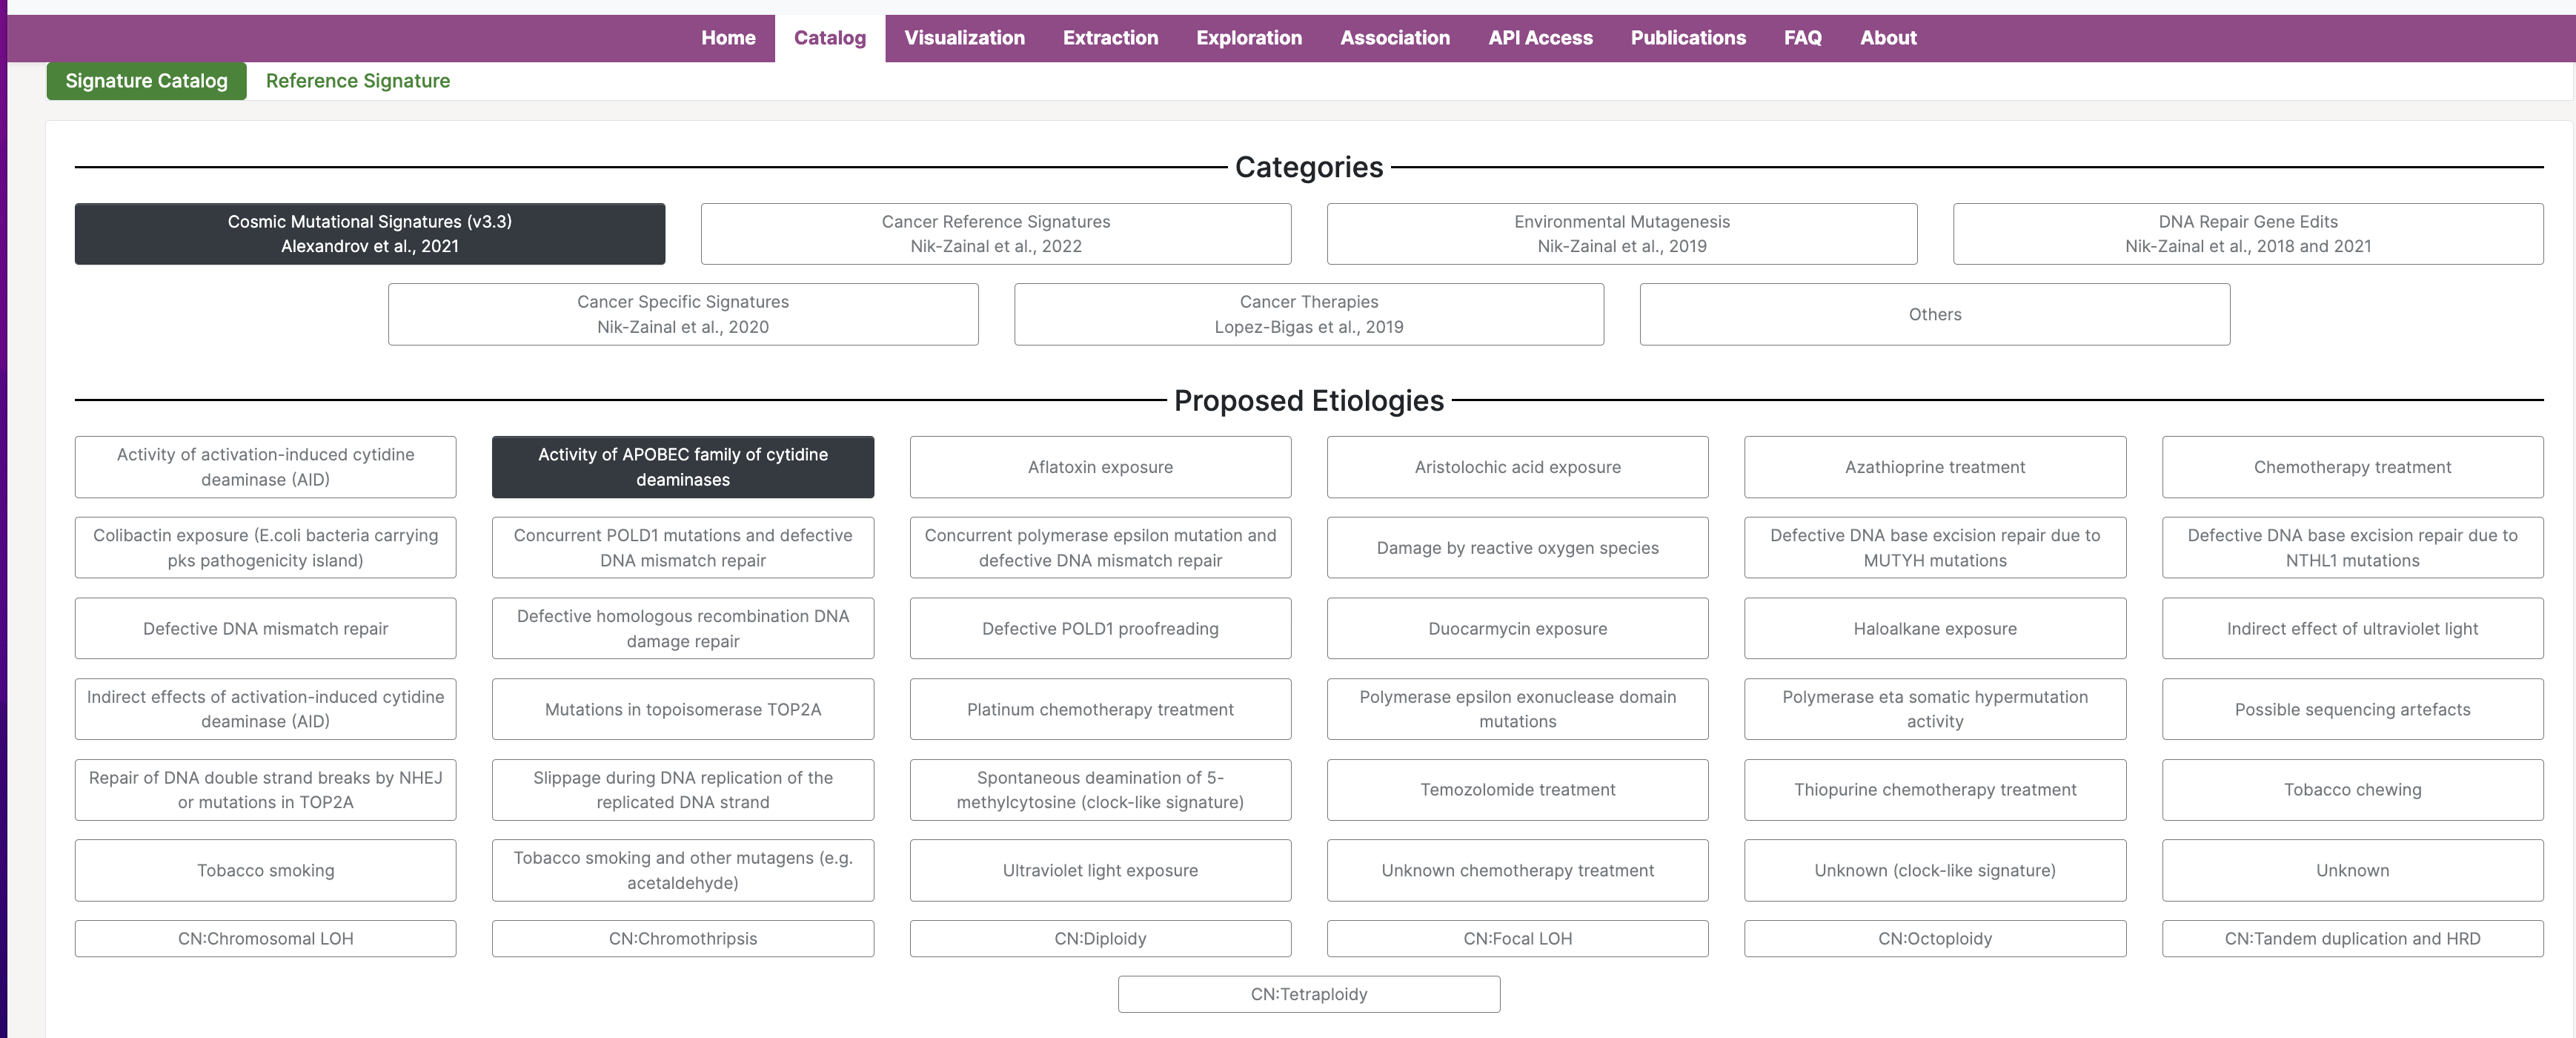
This page is organized into categories of signatures, as well as proposed etiologies. At the bottom of the page, you will find the signatures that correspond to the proposed etiology. You can click on these signatures to access additional information, including the study in which the signature was discovered, additional etiology information and comments, associated signatures, an interactive plot of the mutational signature profile, and tissue distribution details from several genomics studies.
Now, we will explore a few mutational signatures from the Cosmic Mutational Signatures (v3.3) category.
Cosmic Mutational Signatures (v3.3)
Today we will highlight several of the well-known Cosmic (v3.3) mutational signatures. The etiology of these signatures can be endogenous (e.g., DNA mutations due to APOBEC enzymes, DNA repair deficiency etc), or exogenous (e.g.,tobacco smoking, Ultraviolet radiation, cancer therapy treatment etc.), or unkown, meaning the etiology has not been determined yet.
Endogenous signatures
Clock-like signature: SBS1
The proposed etiology of clock-like signature SBS1 is the spontaneous deamination of 5-methylcytosine. The number of mutations corresponding to this signature increases as an individual ages.
18. Click on the Proposed Etiologies option which is the fifth item in the third column from the right, Spontaneous deamination of 5-methylcytosine (clock-like signature).

When you click this etiology, the signature options under Signatures will update with signatures that correspond to the selected clock-like etiology. Here, we can see that the mutational profile for SBS1 is now found under Signatures.

19. Click the SBS1 signature mutational profile. This will expand the page to include additional information about SBS1. You should see the following screen:

You can see that for additional information about this signature, you can click the link under Source.
SBS1 is a well-known signature found to be associated with age. From the signature profile, we can see that there are predominantly CpG>TpG mutations in SBS1, meaning that the mutations are originally cytosine (C) and mutated to a thymine (T) in the context of CpG.
20. Scroll to the bottom of the page to the Tissue Distribution section.
The Tissue Distribution section highlights studies and the samples where the signature was found. You will see a scatter plot of the number of mutations per megabase (log10) for each cancer type in PCAWG where the selected signature was identified. The green numbers across the top of the plot are the total number of samples for a given cancer type, and the blue numbers are those that detected the signature. The red line across each group of dots is the median number of mutations per megabase (log10) in a specific cancer type.
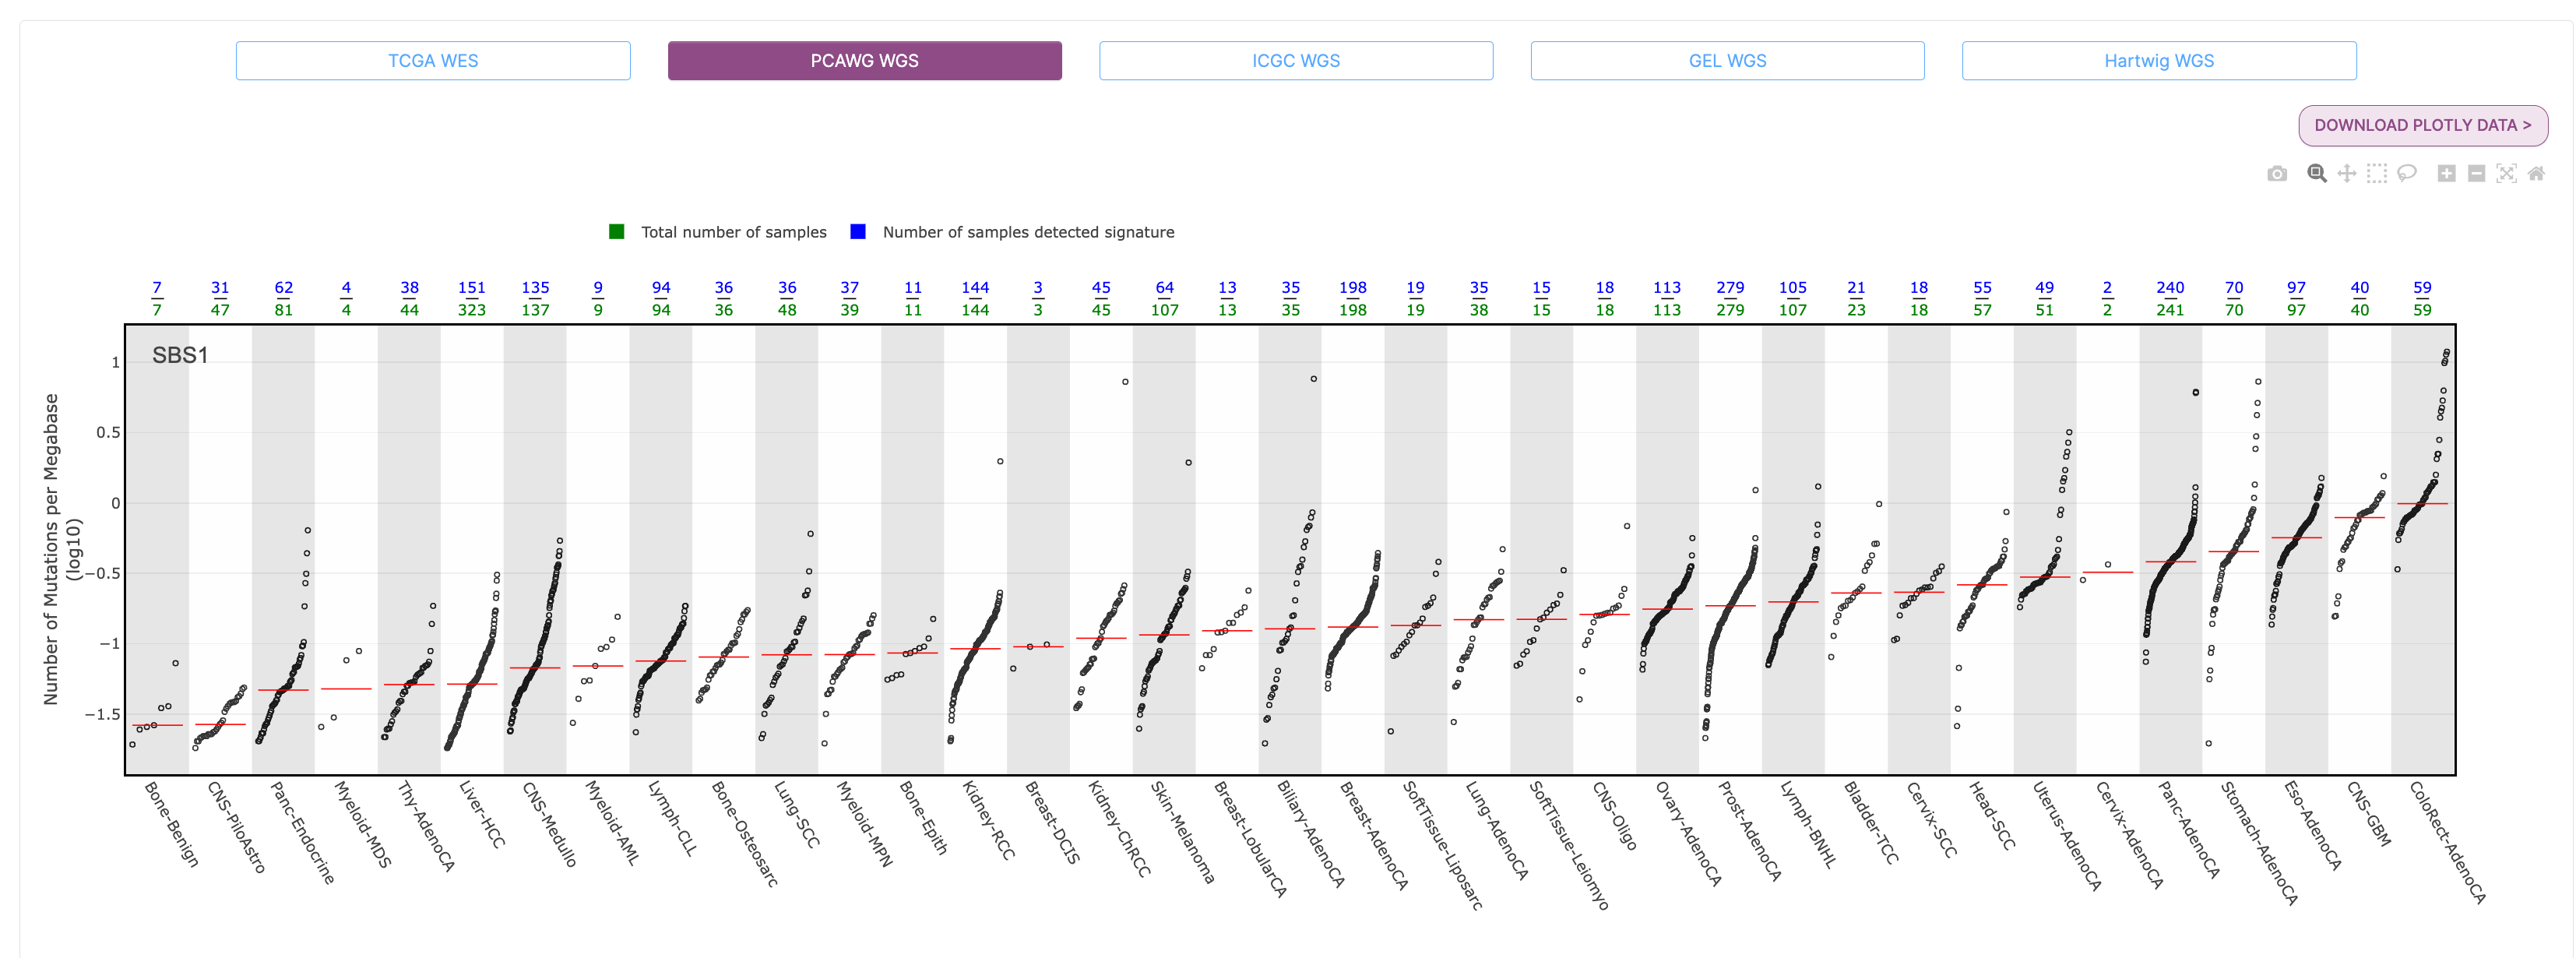
For example, if we look at the PCAWG WGS plot for SBS1, we see that the highest median number of mutations per megabase (log10) were found in colorectal adenocarcinoma samples, followed closely by glioblastoma and esophageal adenocarcinoma.
Note: You can click the camera icon on both the Signatures and Tissue Distribution plots to download the plot to your computer in SVG format.
APOBEC-Related signatures: SBS2 and SBS13
APOBEC enzymes are part of innate immunity and are responsible for restricting viruses and retroelements by deaminating cytosine residues. APOBEC mutagenesis is the off-target effect of the activity of the APOBEC family of enzymes that function as cytosine deaminases. This off-target effect has been predominantly attributed to APOBEC3A and APOBEC3B, which has been implicated in some of the most prevalent mutational signatures in cancer. Recently, a study (paper here) has provided direct evidence that endogenous APOBEC3 deaminases generate prevalent mutational signatures in human cancer cells.
21. Select the first option in the second column under Proposed Etiologies, Activity of APOBEC family of cytidine deaminases.
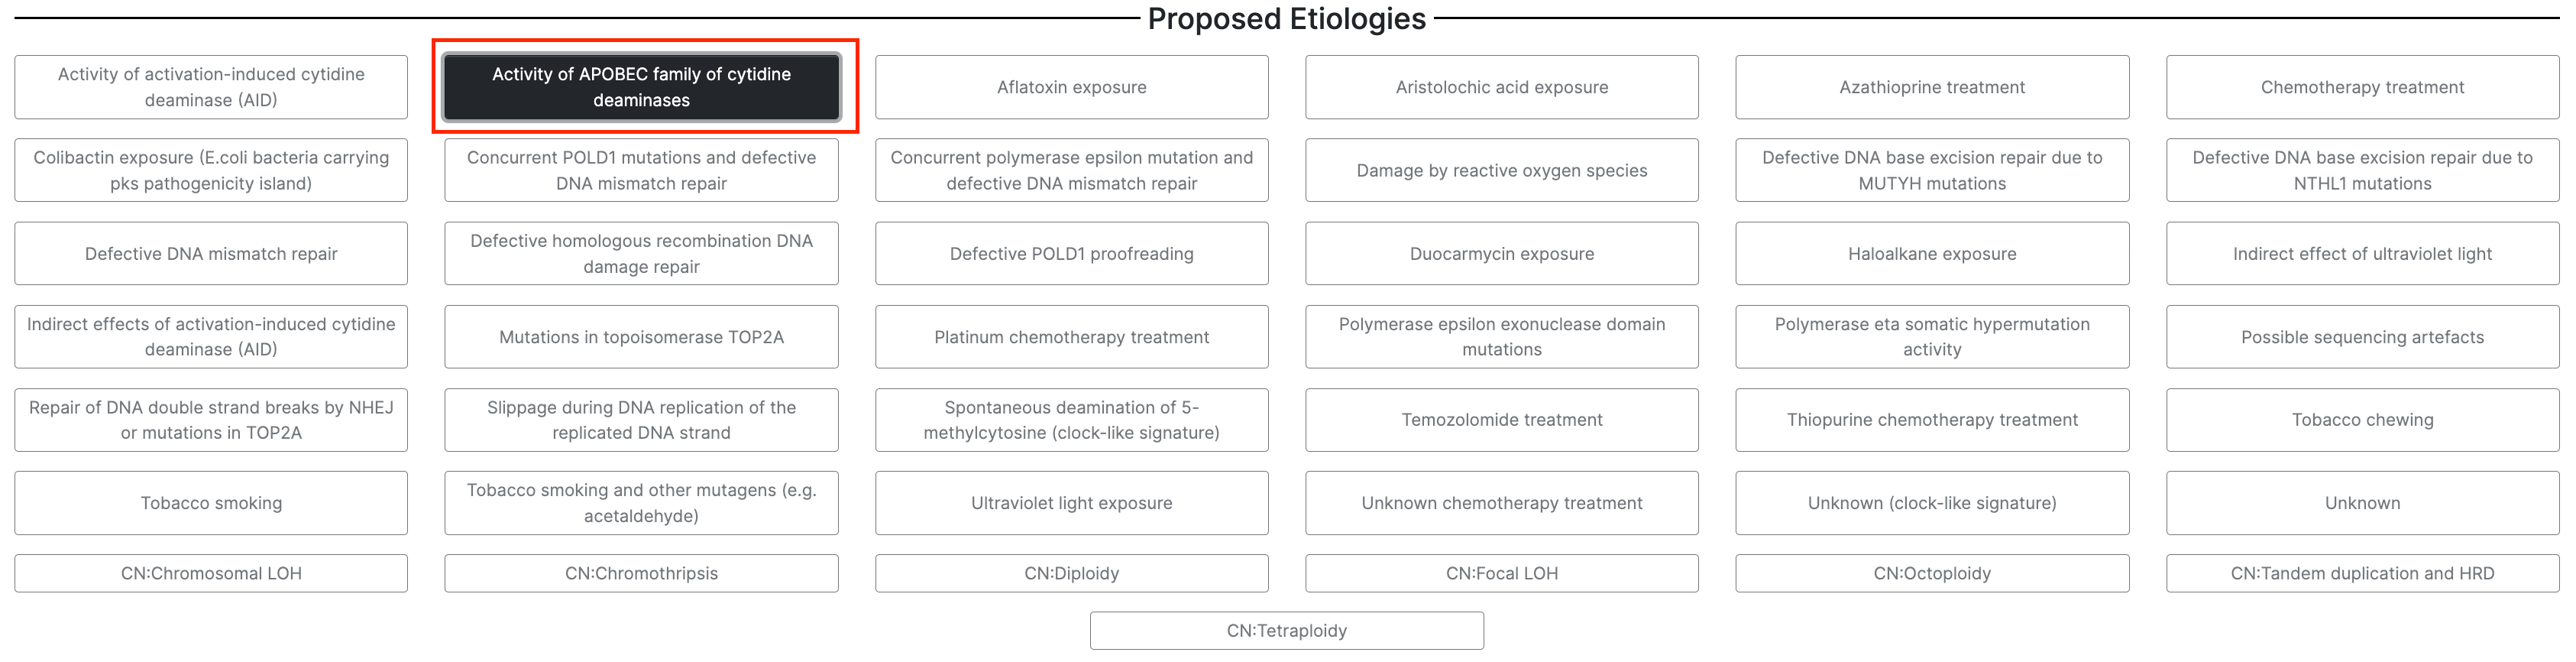
22. Under Signatures, you will see the two APOBEC-related signatures are loaded, SBS2 and SBS13. Select each of these for further exploration.
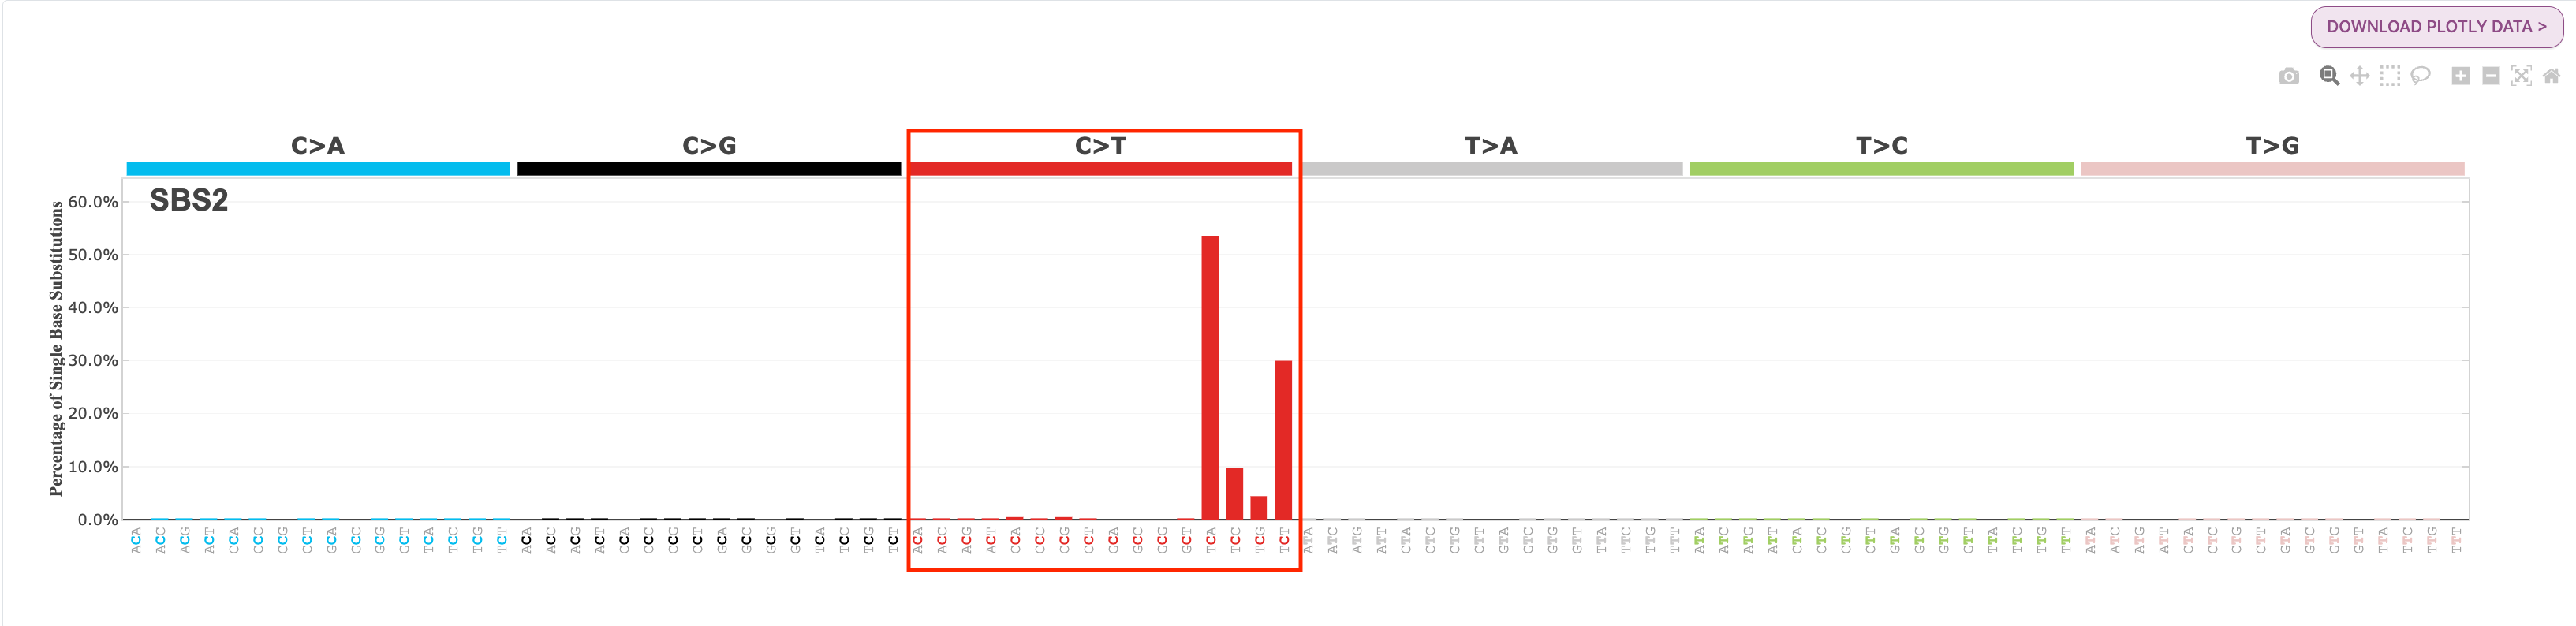
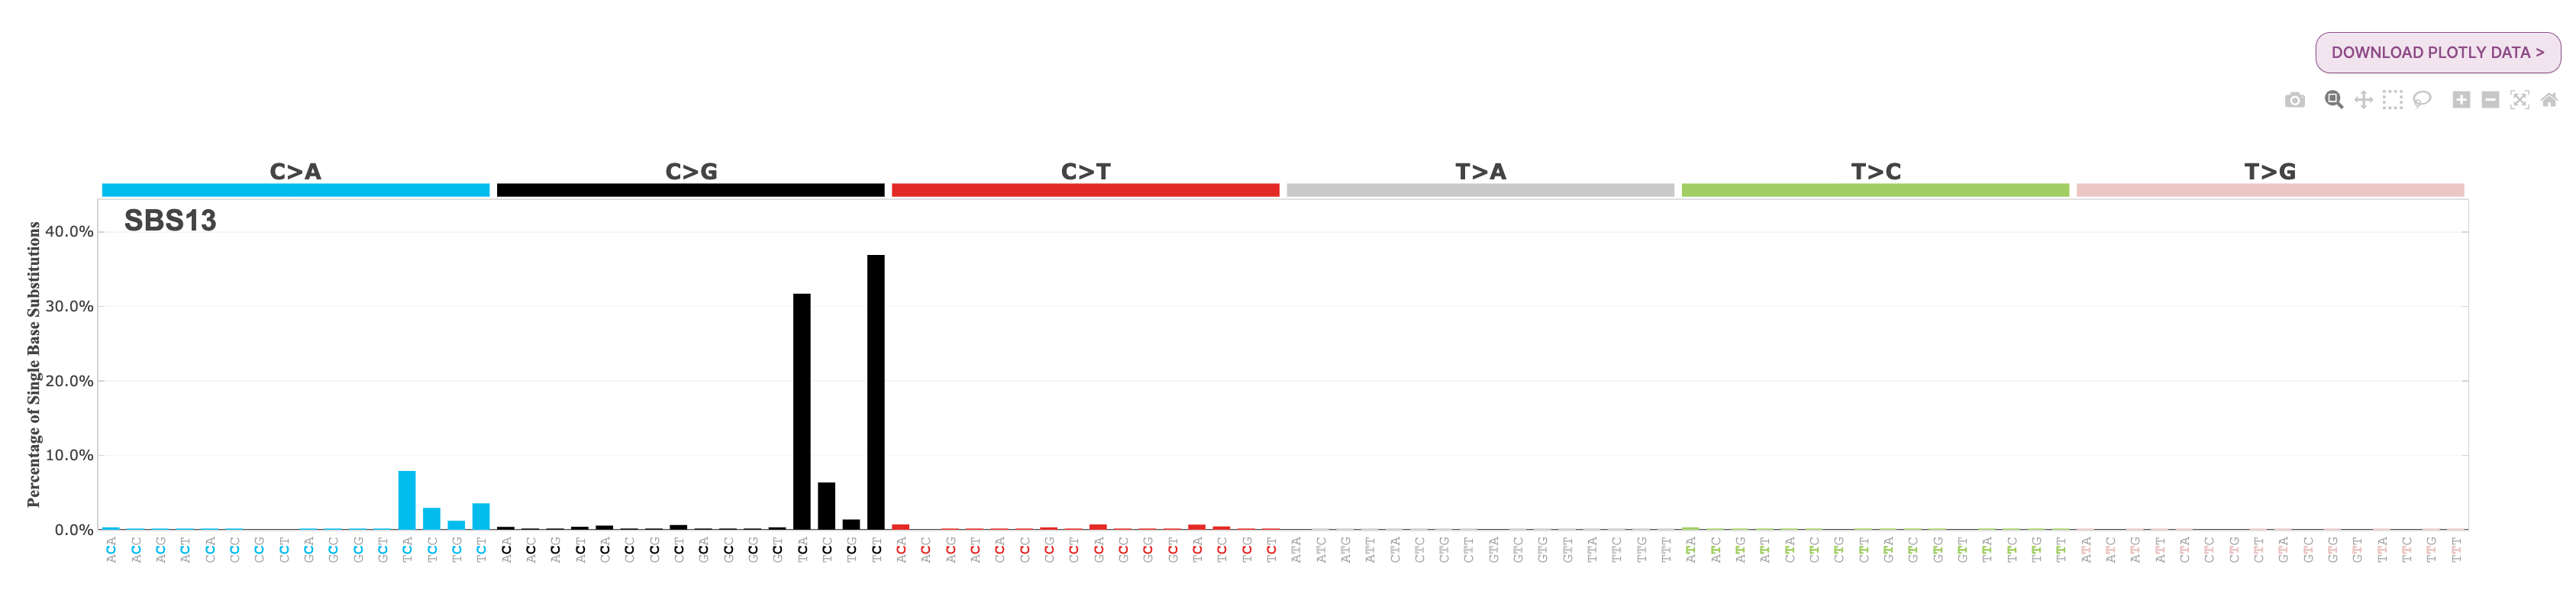
Question: What is the most common substitution subtype for SBS2? What is the most common substitution subtype for SBS13?
Answer
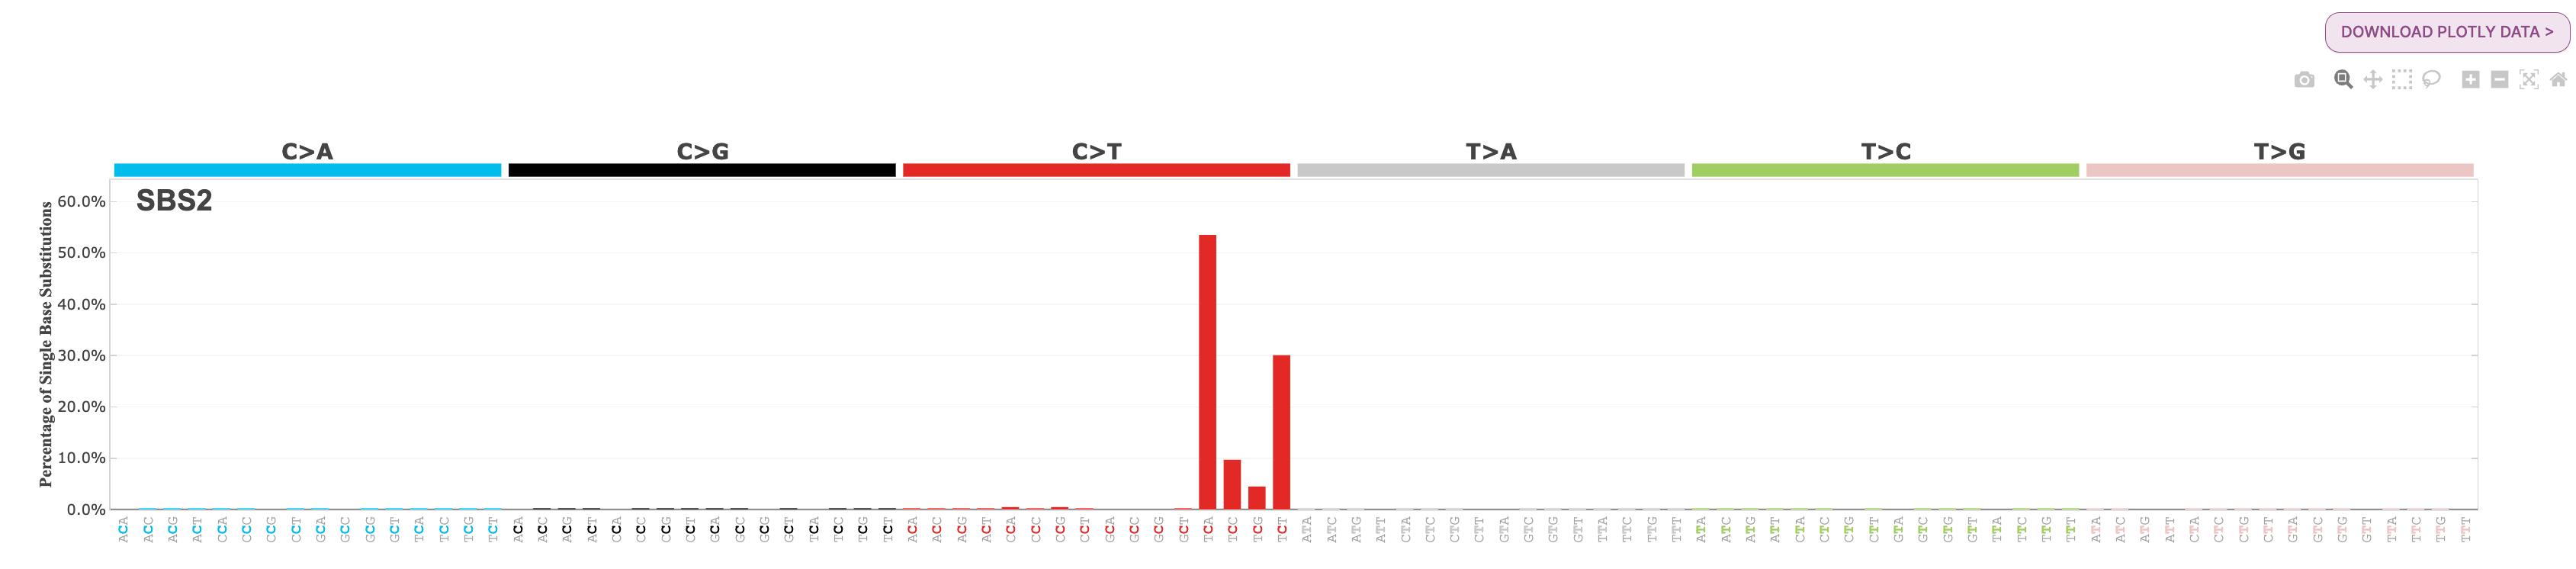
If we look at the signature plot for both SBS2 and SBS13, we see that SBS2 is dominated by C>T mutations at the TCW context, and SBS13 is dominated by C>G mutations at TCW context. You will find each of these profiles below for your reference:
Note: The ‘W’ in the TCW context means that the base can be either an A or a T. There are a series of IUPAC codes for nucleotide bases to indicate specific mutational types. There is additional information about these codes on the mSigPortal FAQ page here, under the question: What is the meaning of IUPAC codes for nucleotide bases indicating specific mutational types?

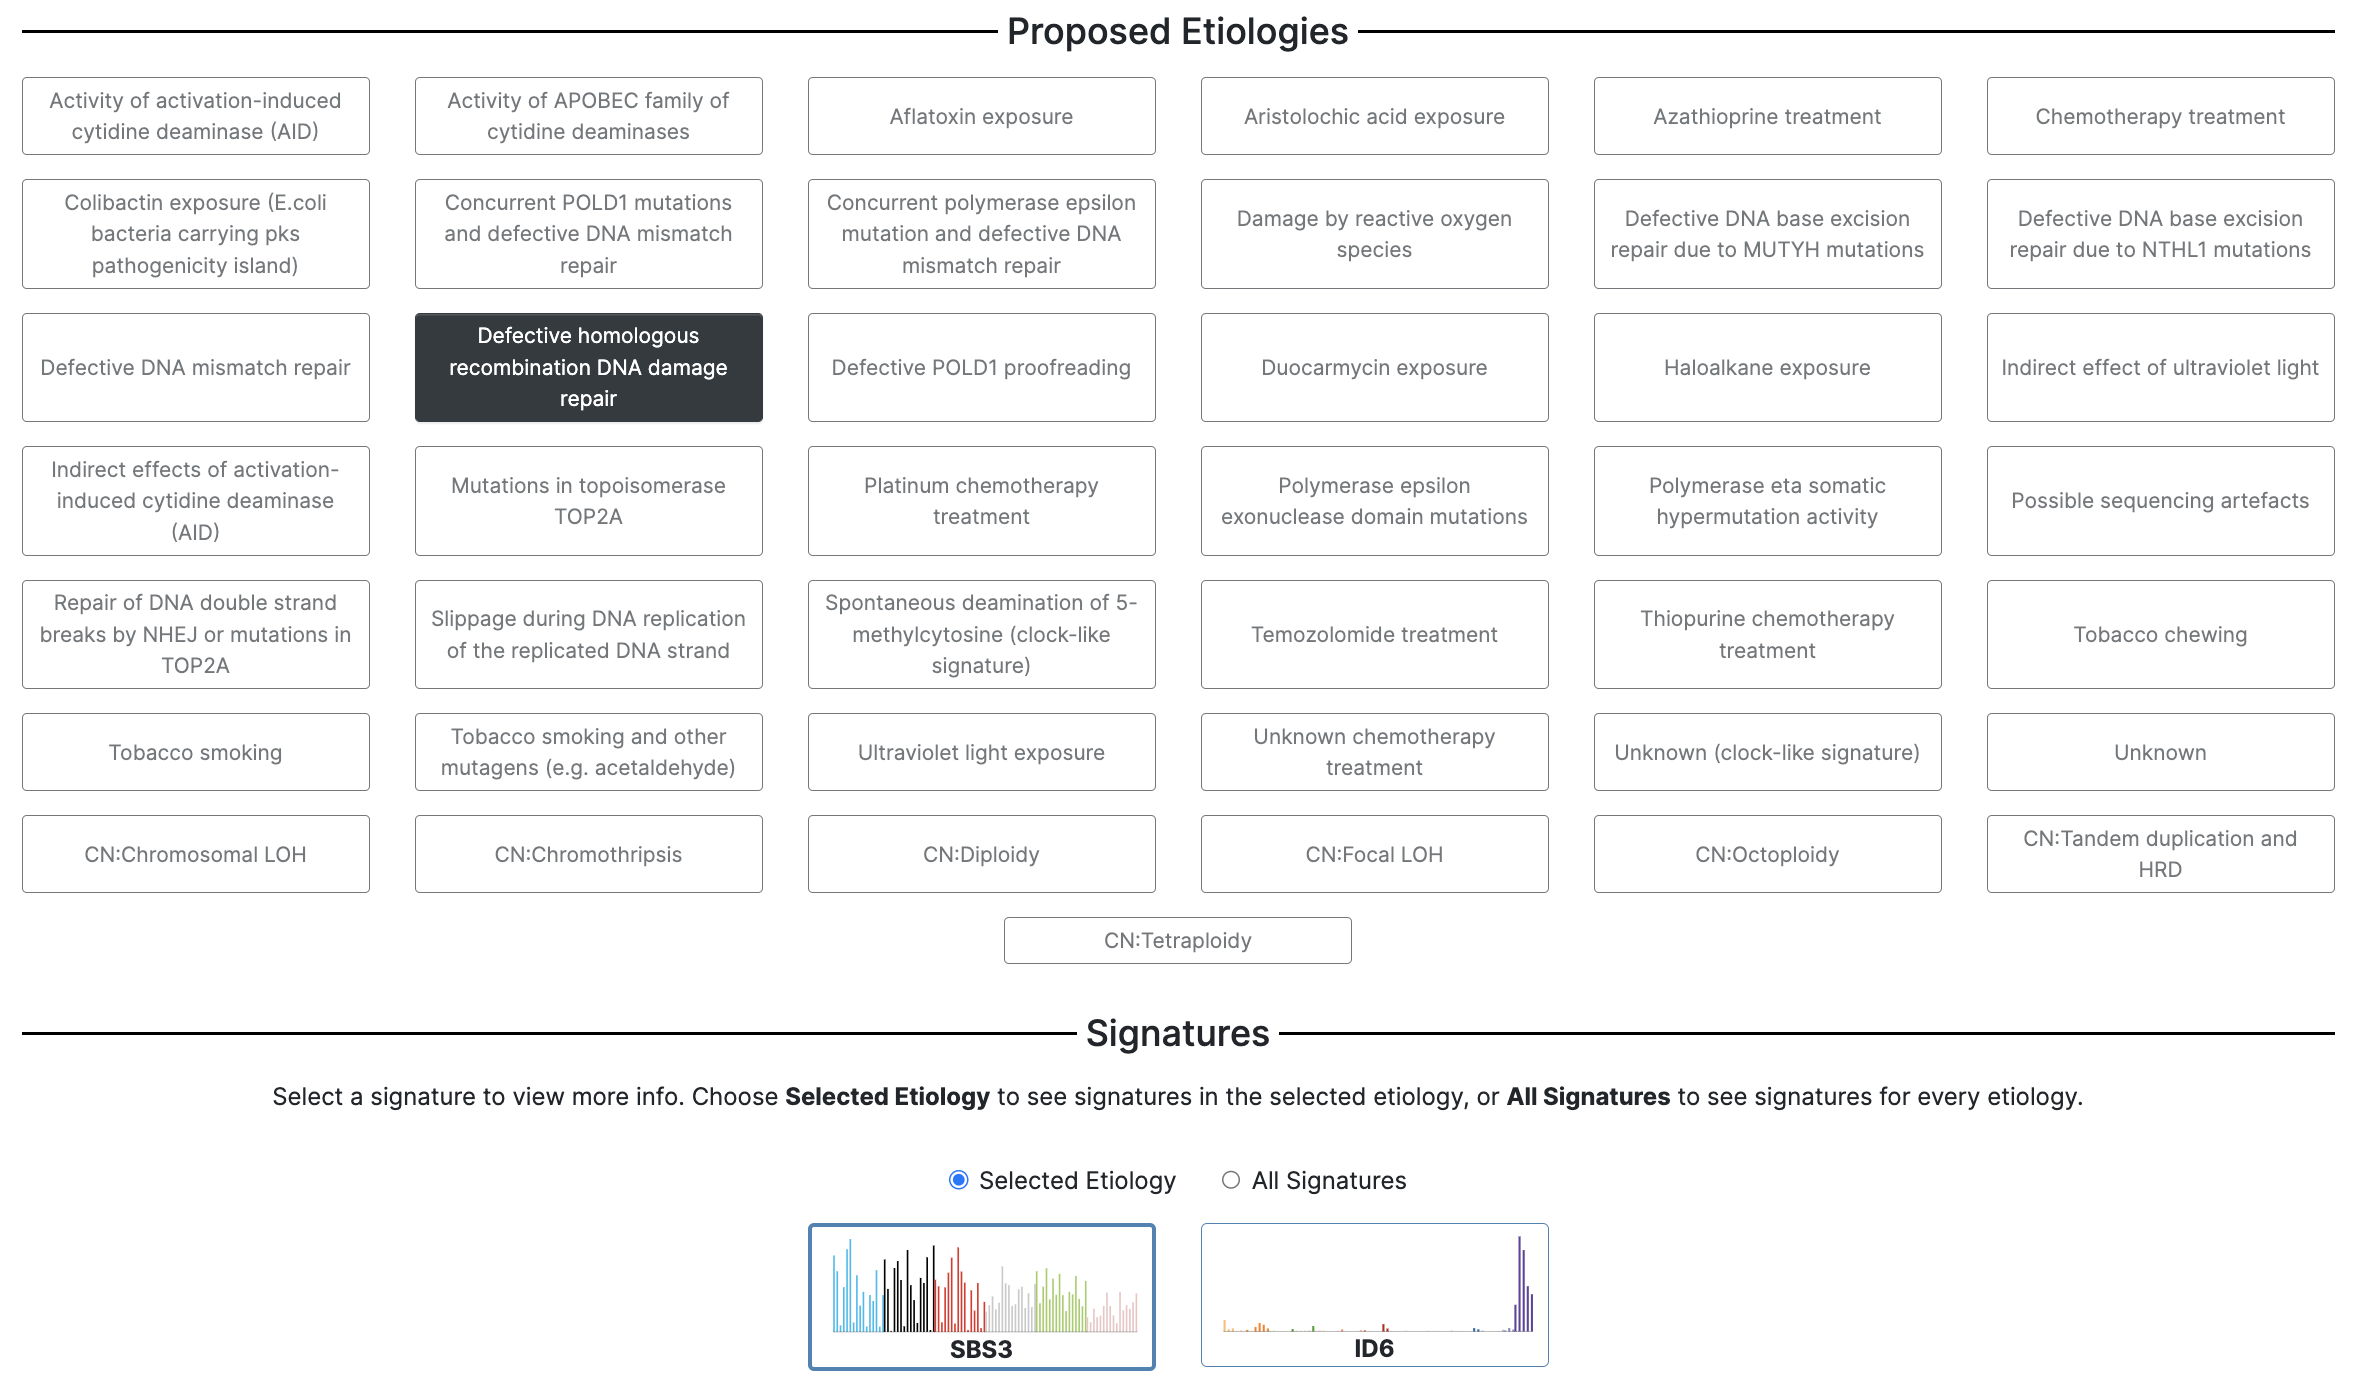
Homologous recombination deficiency (HRD) signature: SBS3
This signature is caused by defective homologous recombination-based DNA damage repair.
23. Now under Proposed Etiologies select the third option in the second column: Defective homologous recombination DNA damage repair.
24. Under Signatures, you will see the two HRD signatures are loaded, SBS3 and ID6. SBS3 is a single base substitution signature, and ID6 is an indel (insertion/deletion) signature. Select SBS3 for further exploration.
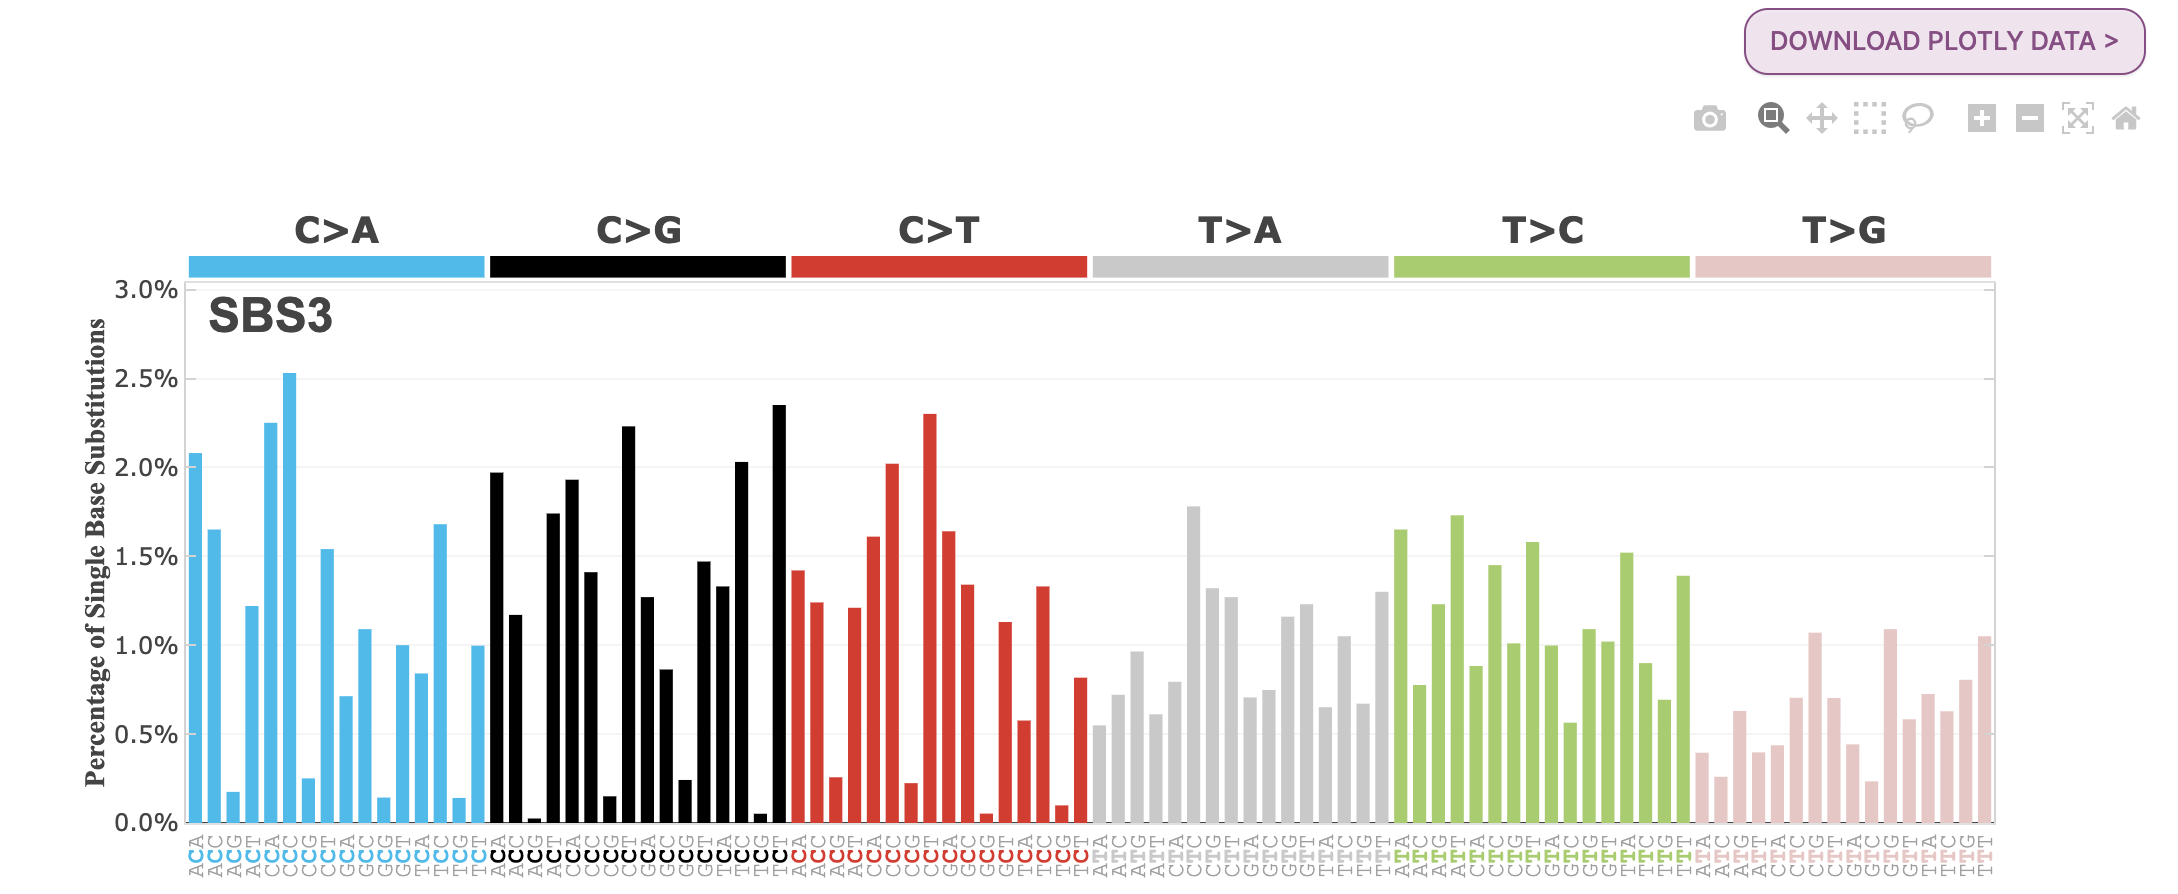
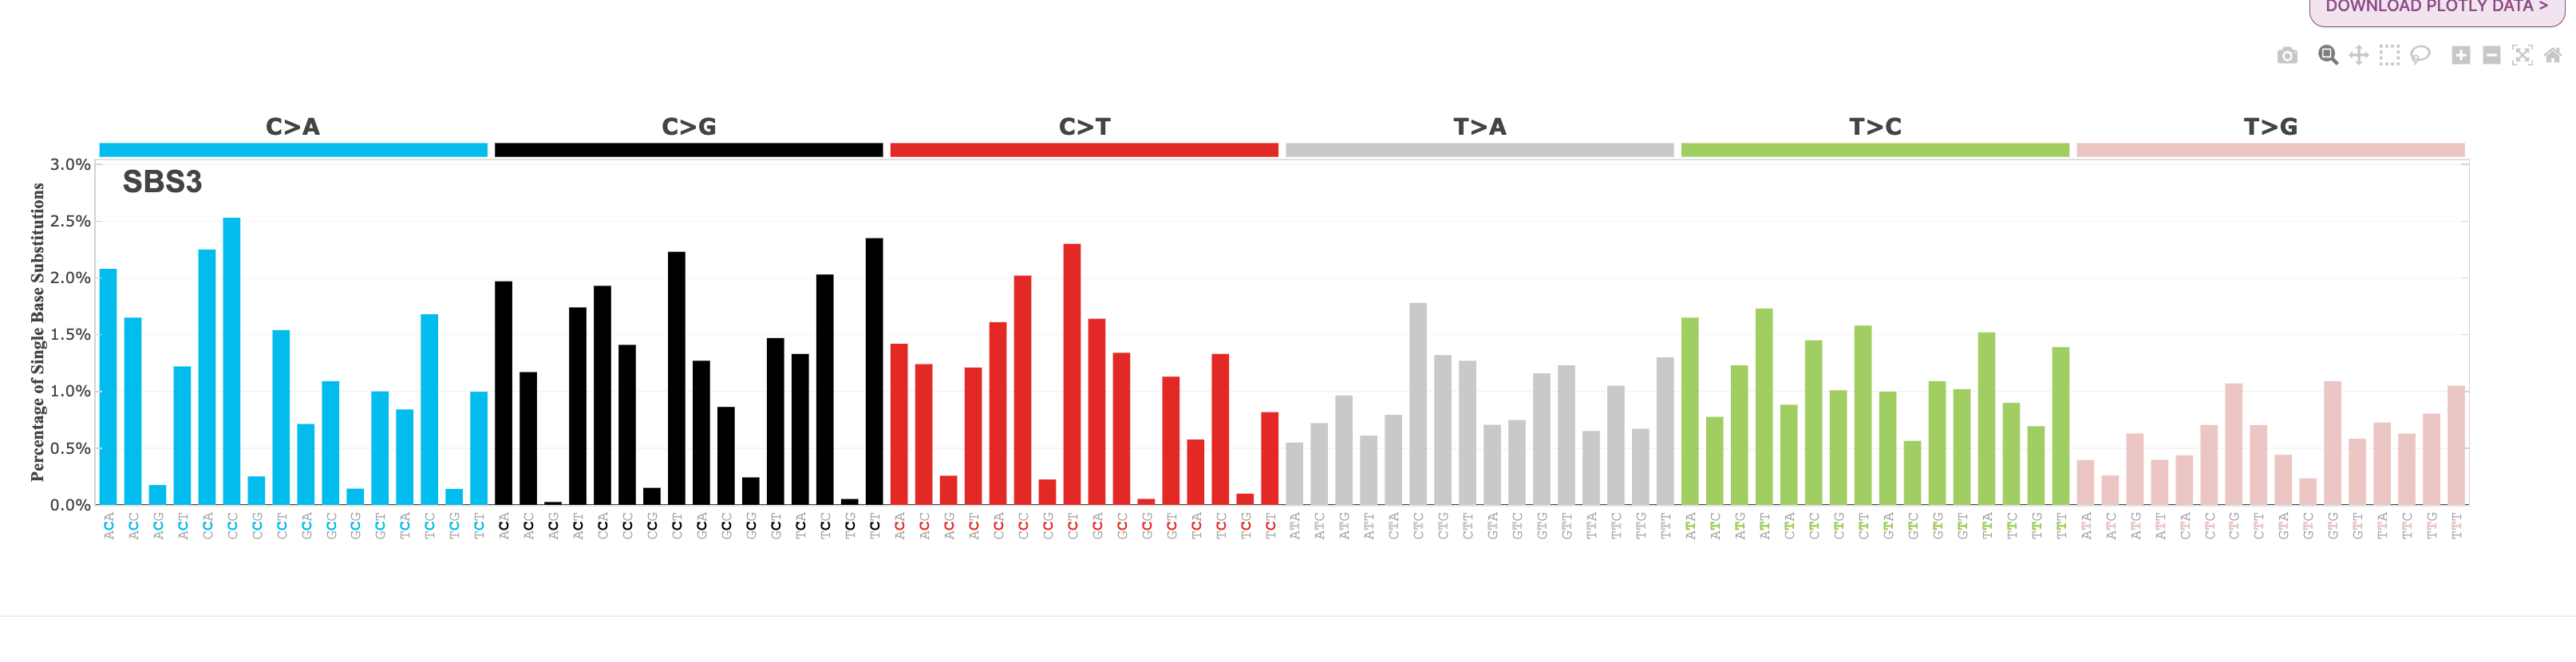
Question: Explore the SBS3 signature related to homologous recombination deficiency. What are the features of mutational signature SBS3? Which cancer types identified SBS3? What is the clinical implication for patients with SBS3 mutations?
Answer
SBS3 is a “flat” mutational signature characterized by a high Shannon equitability index of 0.96, indicating that it is not dominated by a few specific mutation classes and has a relatively consistent number of mutations across all mutation classes. This signature has been frequently observed in breast, pancreatic, and ovarian cancers.
SBS3 has been found to be strongly associated with germline and somatic BRCA1 or BRCA2 mutations and also responds to platinum therapy. Therefore, SBS3, along with other indel and rearrangement signatures, has been proposed as a predictor of homologous recombination deficiency (HRD) and response to therapies.
Exogenous signatures
Tobacco smoking associated signature: SBS4
25. Tobacco smoking can be found in the first column in the sixth row of the proposed etiologies in the Cosmic Mutational Signatures (v3.3) category.
Question: What are the different signatures associated with tobacco smoking etiology?
Answer
In the Cosmic Mutation Signatures (v3.3) category, we see that tobacco smoking is associated with SBS4, SBS92, and ID3.

Focusing on SBS4, this signature is dominated by C>A mutations, and is identified in almost every lung cancer case in smokers, allowing for it to be used as a strong marker for smoking status. SBS4 can also be observed in other cancer types such as head and neck and liver cancer.
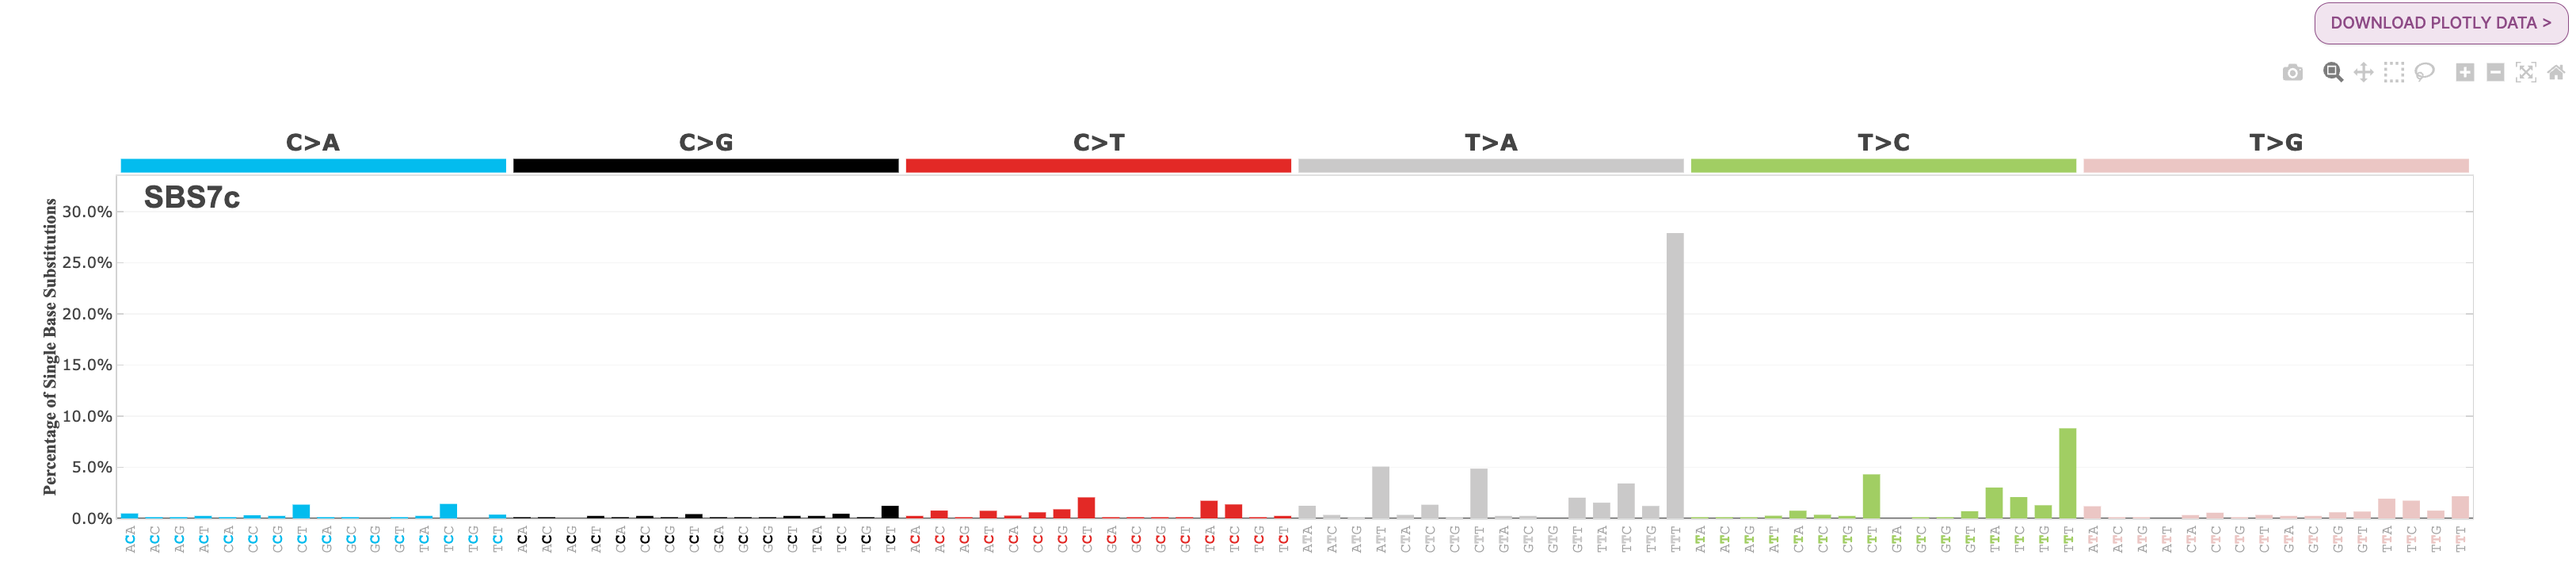
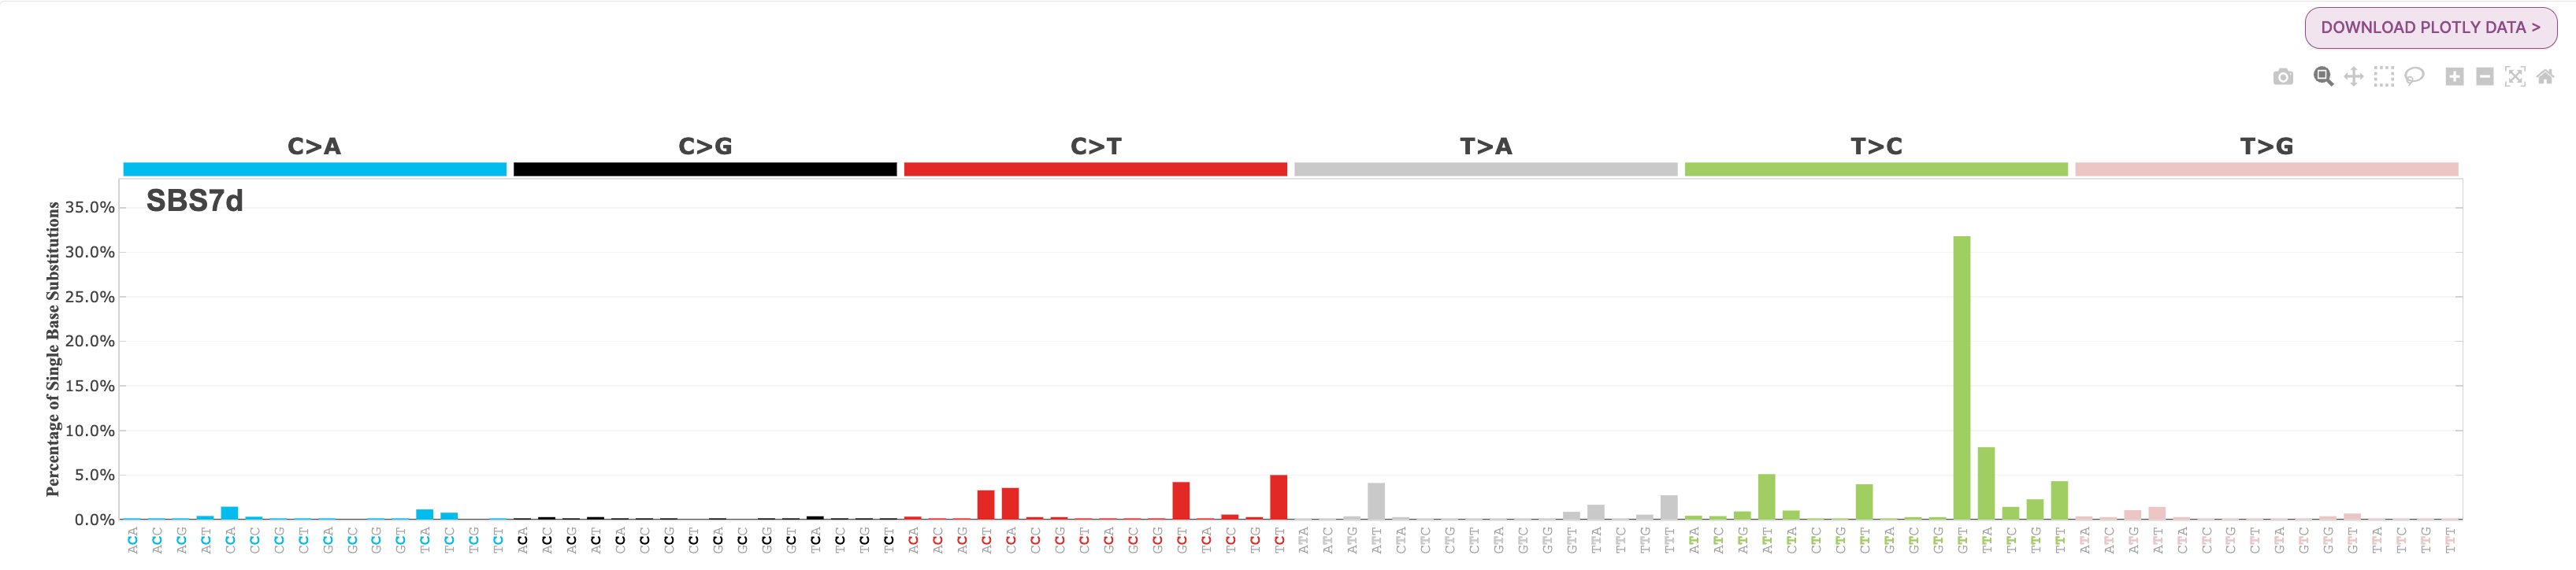
Signature related to ultraviolet light exposure: SBS7
26. Ultraviolet light exposure can be found in the sixth row of the third column in the Cosmic Mutational Signatures (v3.3) category.
Question: You will see that there are several UV light exposure-associated signatures, where the SBS signatures are a variation of SBS7. How many variations of SBS7 are there? What are the differences between them?
Answer
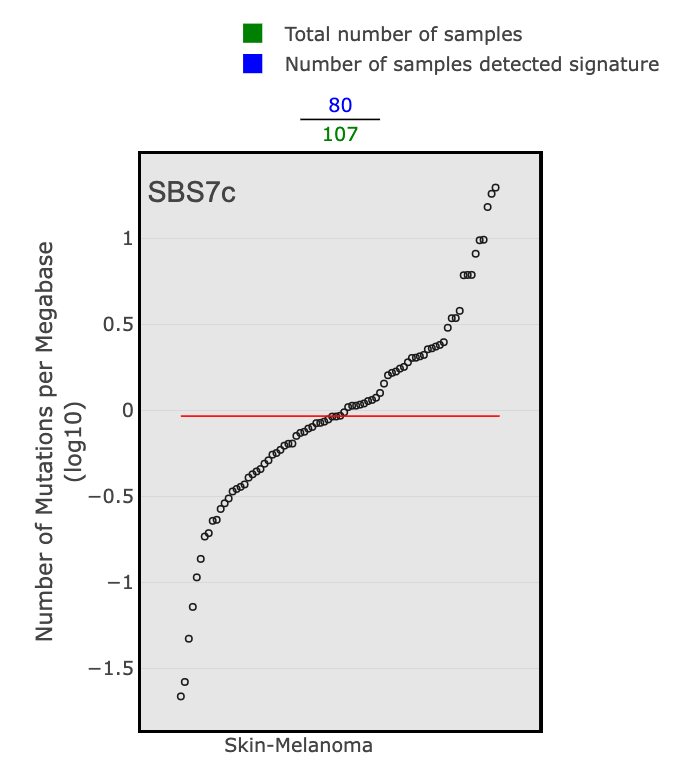
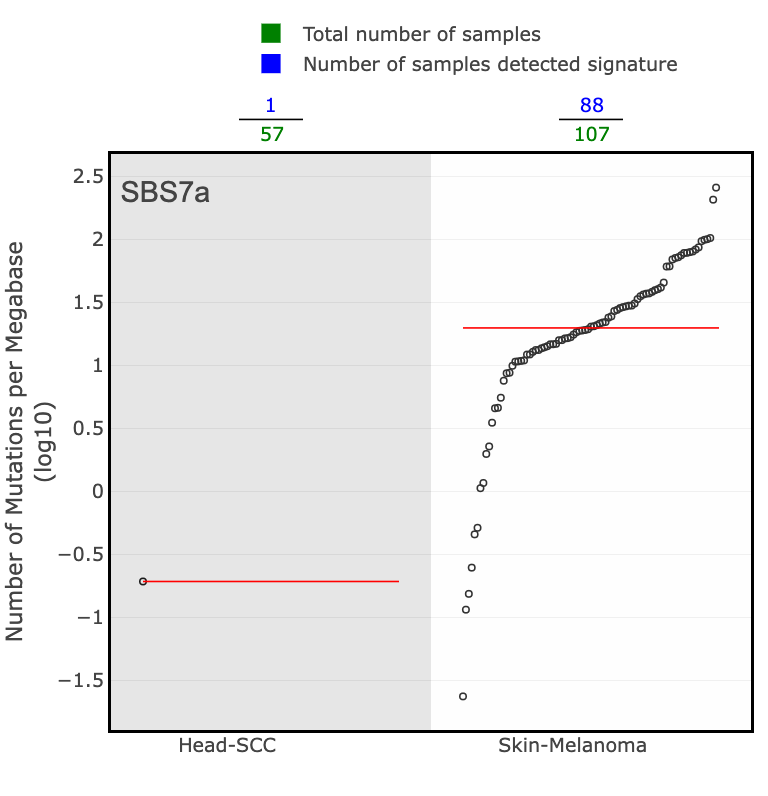
There are 4 SBS7 variations associated with UV light exposure. These include SBS7a, SBS7b, SBS7c, and SBS7d.
- SBS7a: dominated by C>T mutations, especially in the TCM context
- SBS7b: dominated by contexts across C>T mutations
- SBS7c: a more diverse mutational profile, but there is a spike in T>A mutations in the TTT context
- SBS7d: a bit more of a diverse profile, but there is a spike in T>C mutations in the GTT context.
Below are the mutational profiles of each for your reference:


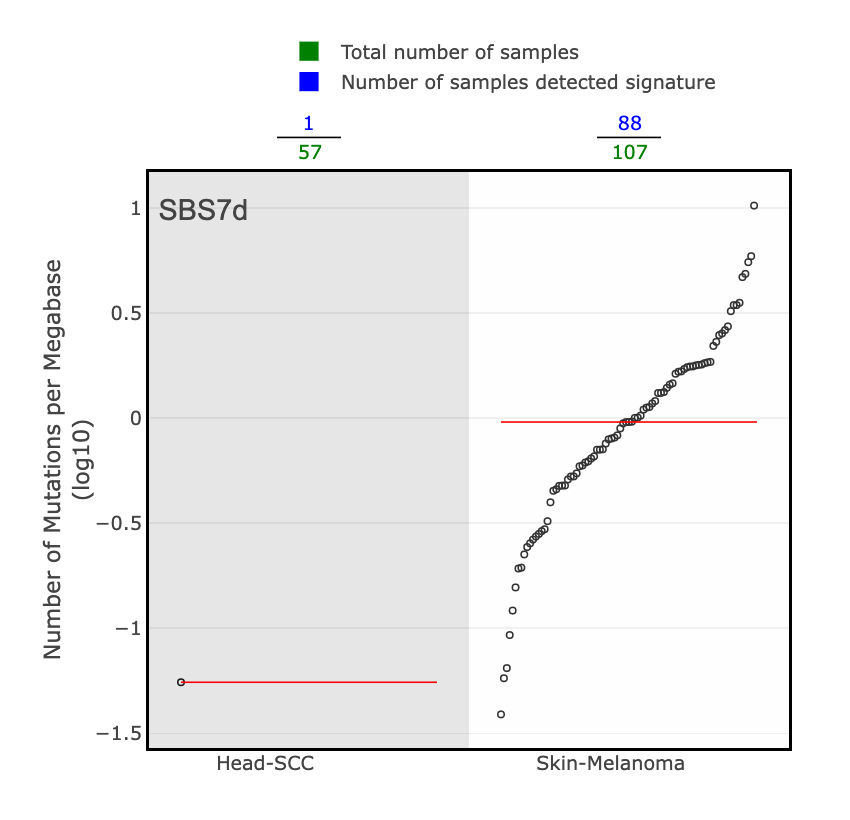
Question: What is the predominant cancer type associated with SBS7?
Answer
Skin cancer is the predominant cancer type associated with SBS7. This can be determined by looking at the tissue distribution details from a few large genomics studies for each SBS7 variation. Here are just a few examples:
Note: There are other non-SBS signatures associated with UV light exposure. These include DBS1 and ID13.
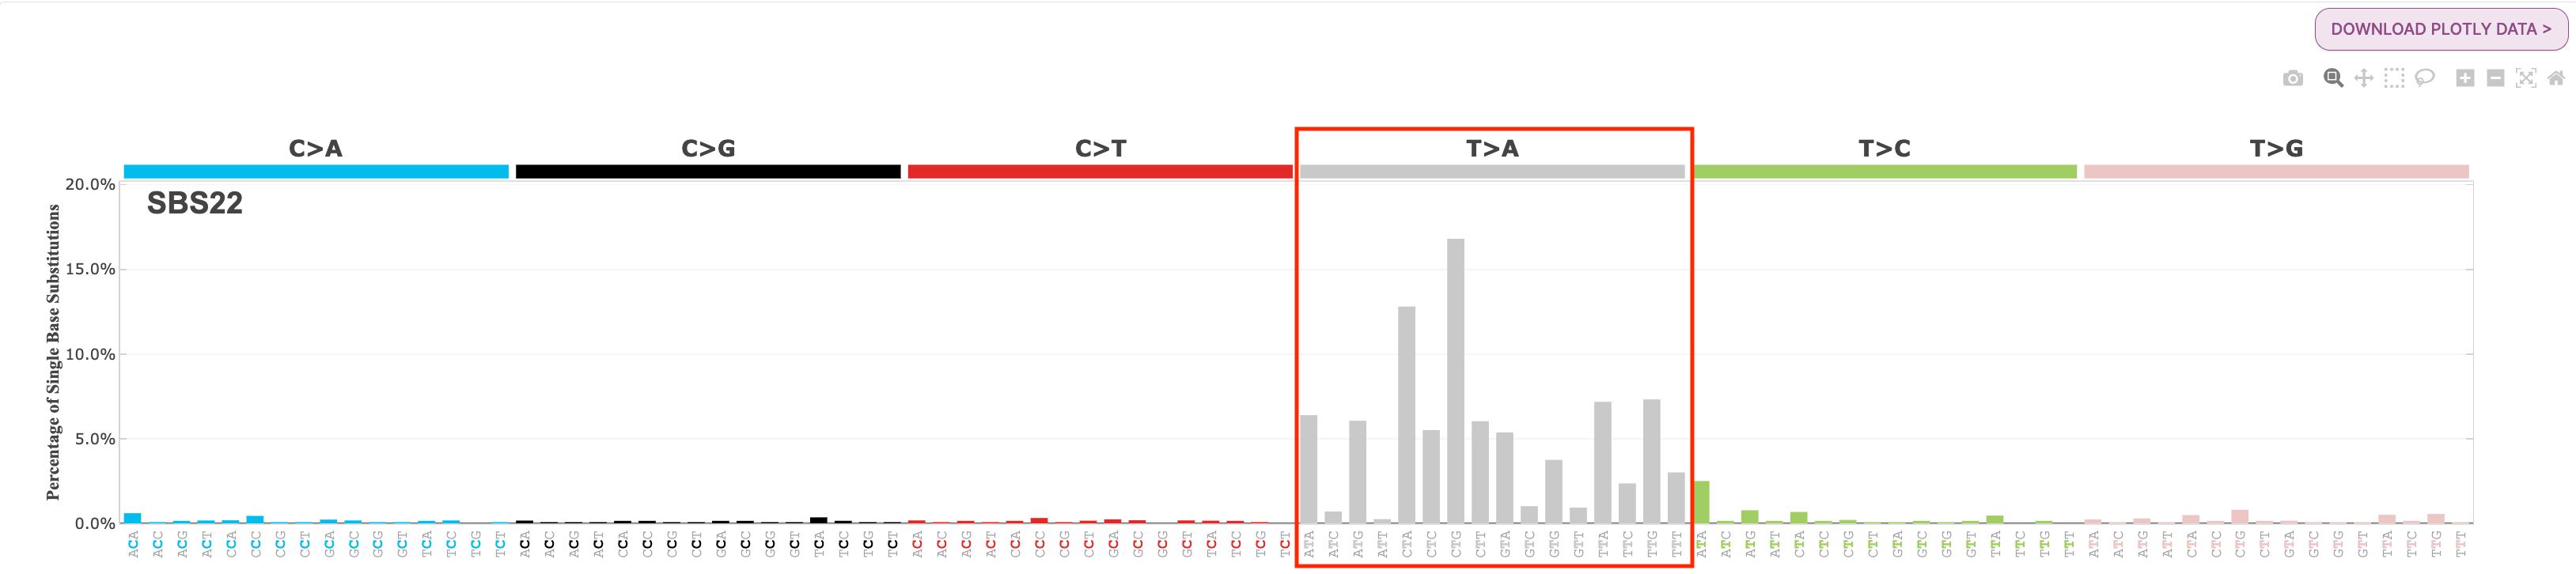
Aristolochic acid exposure-related signature: SBS22
27. Aristolochic acid exposure can be found in the fourth column of the first row in the Cosmic Mutational Signatures (v3.3) category.
Question: What is the dominant mutation subtype of SBS22? What cancer types is SBS22 associated with?
Answer
SBS22 is dominated by the T>A mutation type, with mutations found in all mutation contexts for this type. Regarding cancer types, we can see in the larger genomic studies under Tissue Distribution that SBS22 is commonly found associated with liver and kidney cancer.
Environmental Mutagenesis signature: PAH- Benzo[a]pyrene-diol epoxide
28. Select the Environmental Mutagenesis category.

29. Select PAHs under Proposed Mutagens.

30. You will see that there are several signatures caused by different PAHs. Polycyclic aromatic hydrocarbons (PAHs) are a class of chemicals that are known to be mutagenic, meaning they can cause changes or mutations in the genetic material of an organism. These changes can potentially lead to the development of cancer and other diseases. PAHs are found in a variety of sources, including tobacco smoke, which is considered to be a major contributor to PAH exposure. Among the various mutagenic compounds found in tobacco smoke, PAHs are considered to be among the most significant and harmful. It is important to note that PAHs are not limited to tobacco smoke and can also be found in other sources such as car exhaust, industrial emissions, and certain types of grilled or smoked food. For our purposes today, we are going to select the fourth PAH in the first row, the Benzo[a]pyrene-diol epoxide 0.125 uM (SBS) signature.
Question: What is the dominant mutation subtype in the Benzo[a]pyrene-diol epoxide 0.125 uM (SBS) signature?
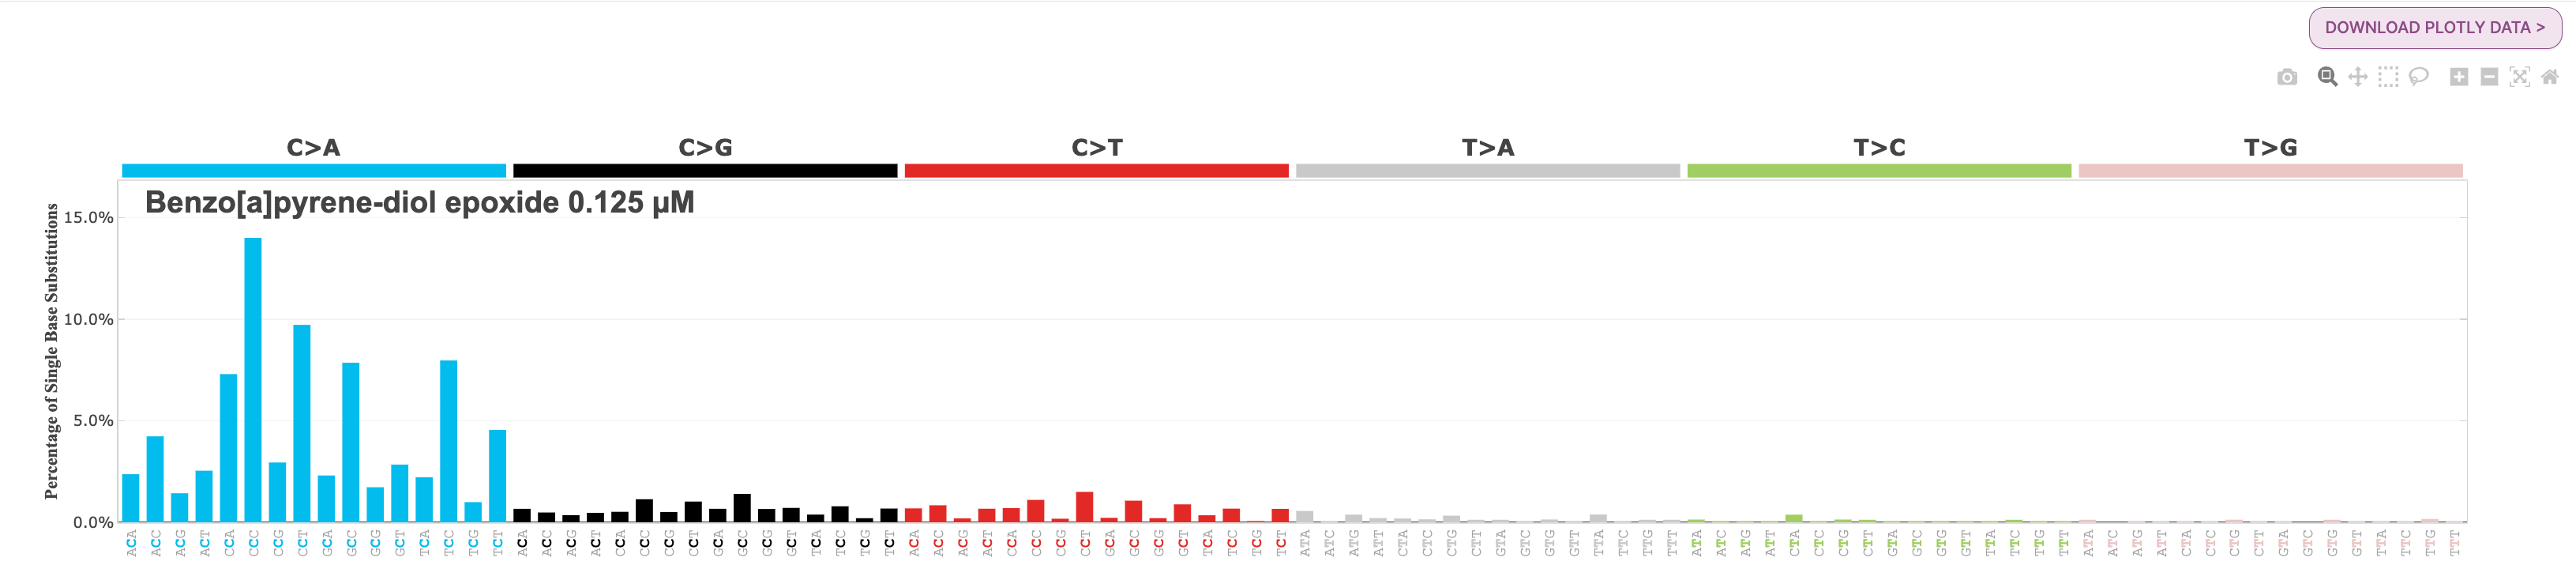
Answer
C>A mutations are dominant, especially in the CCY context (CCC or CCT).
Explore reference signatures in mSigPortal (mSigPortal Catalog)
Now we are going to take a look at the reference signatures available in mSigPortal. Reference signatures available include several different profile types (SBS, DBS, ID, RS) and matrix sizes. Reference signatures include those for human, mouse, and rat.
31. Click on the Reference Signature tab in the top left corner.

This will take you to the Reference Signature part of the Catalog module, specifically the RS in mSigPortal page. This page contains a series of pie charts organizing the different reference signatures available on mSigPortal:
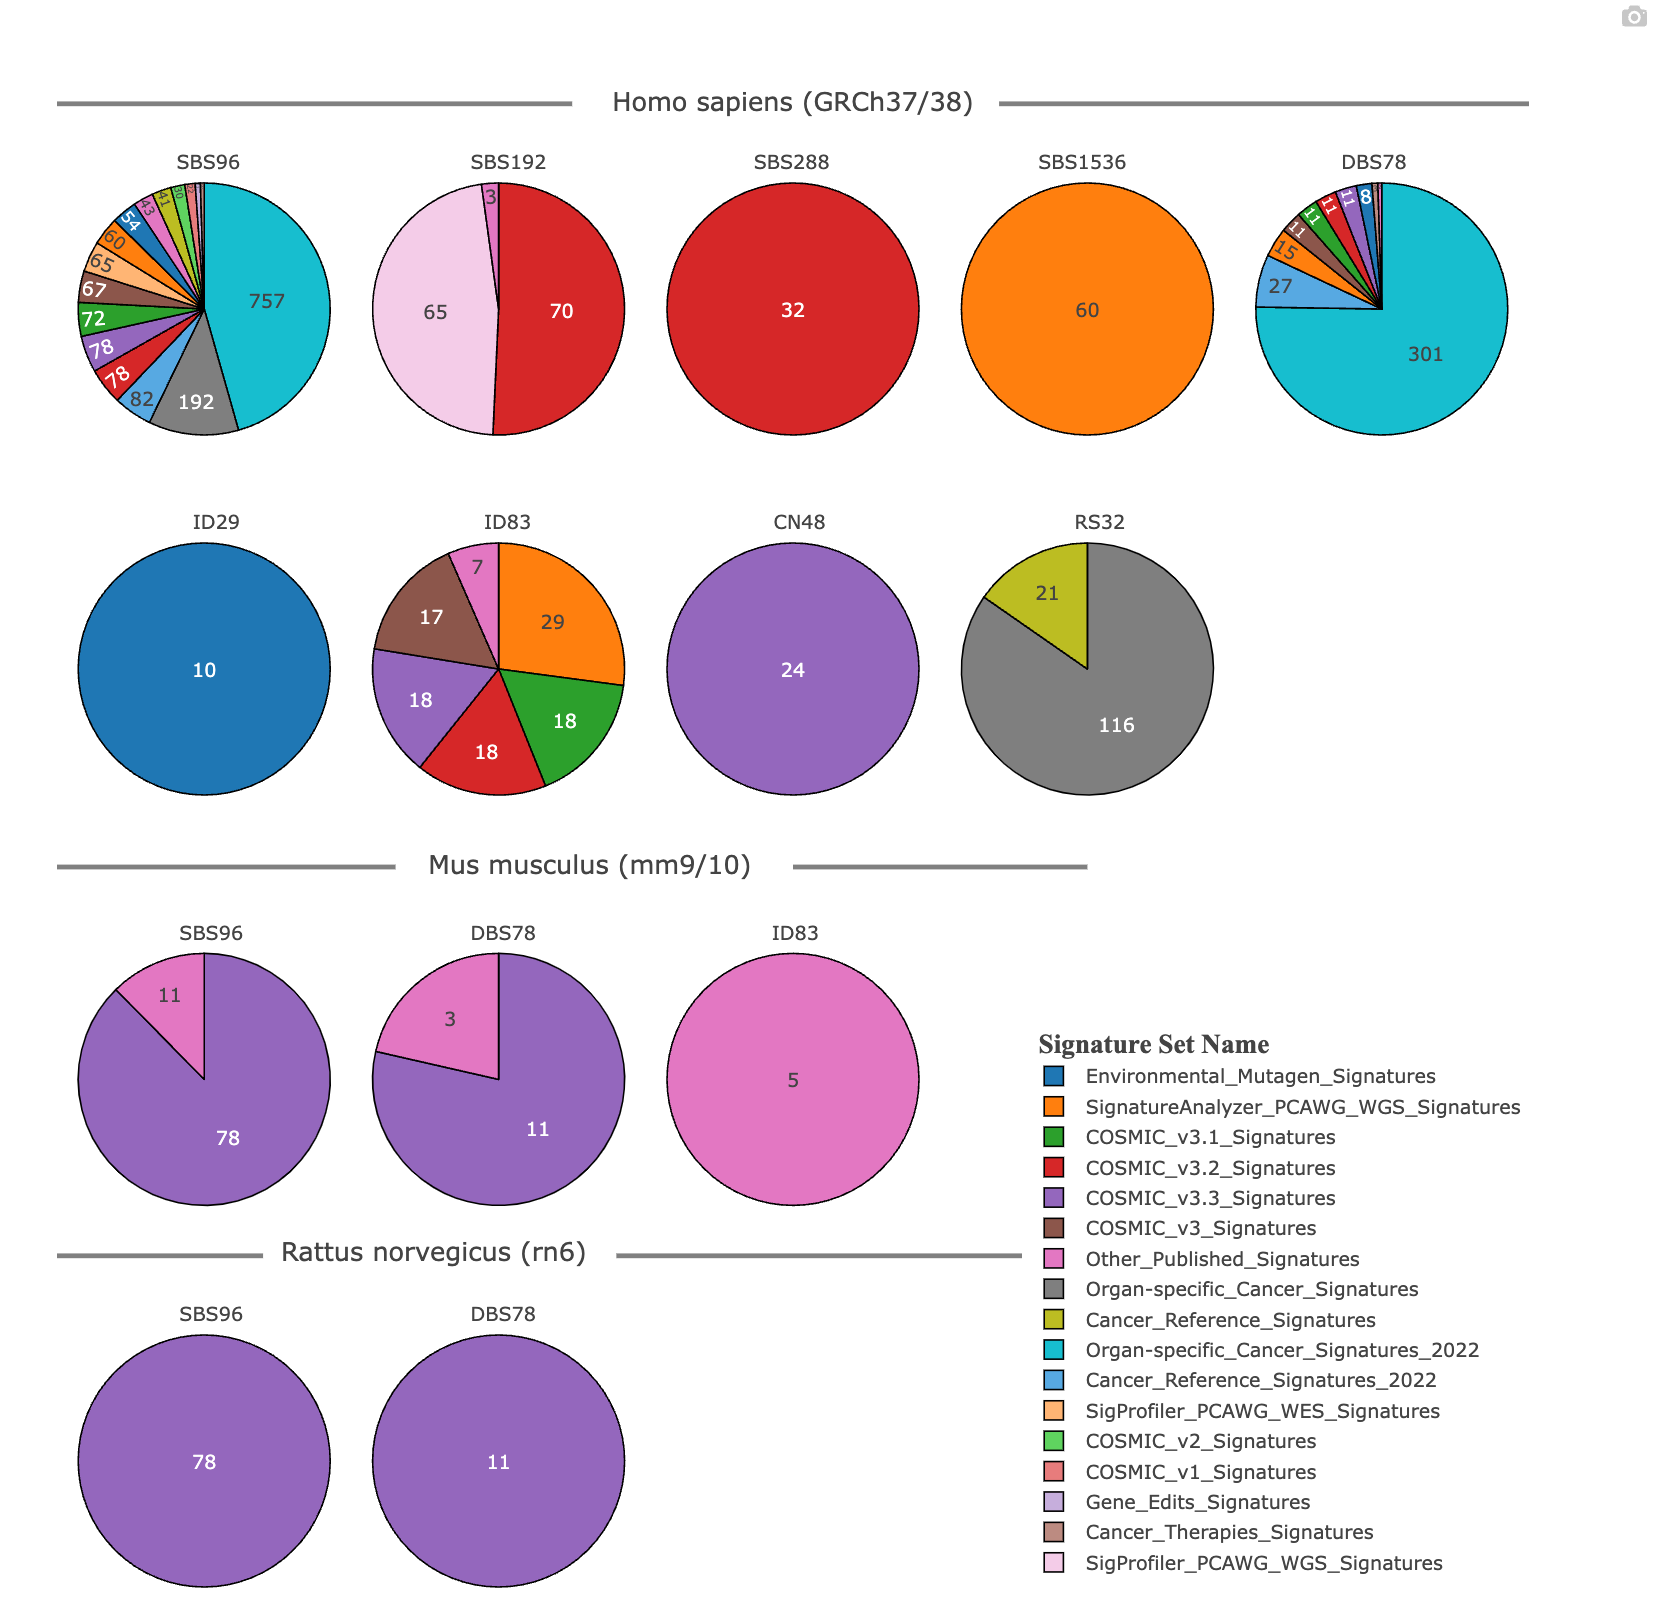
The pie charts display the current reference signatures available in mSigPortal for human (GRCh37/38), mouse, and rat genome (GRCm38). Each pie chart represents a given mutational signature defined by the profile type (SBS, DBS, ID, RS) and its respective matrix size. Each signature set included in mSigPortal is denoted by a color in the legend on the right. The numbers and coloring in each chart represent the number of signatures included and the signature source, respectively.
Now we will explore some of the reference signatures.
RS Profile
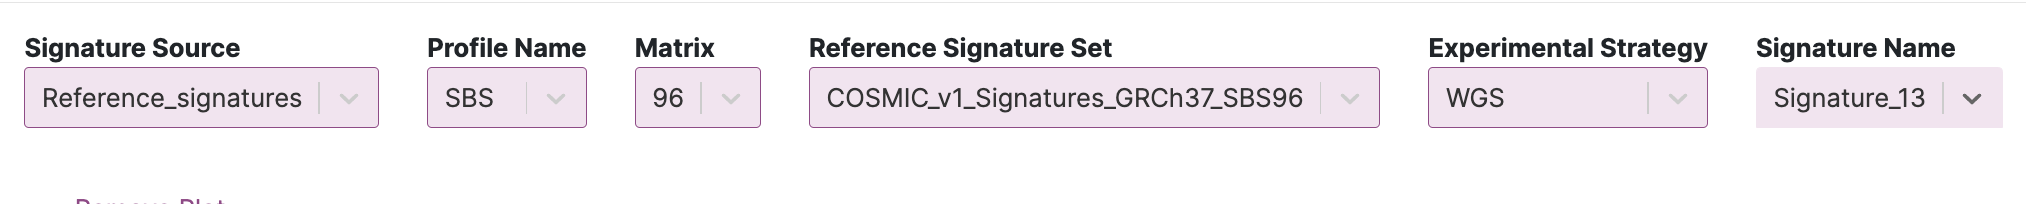
32. Click the RS Profile tab (next to the RS in mSigPortal tab). We are going to compare SBS2 and SBS13 from Cosmic v1. Set the input parameters to the following for SBS2:


You will see the following signature profile for SBS2:
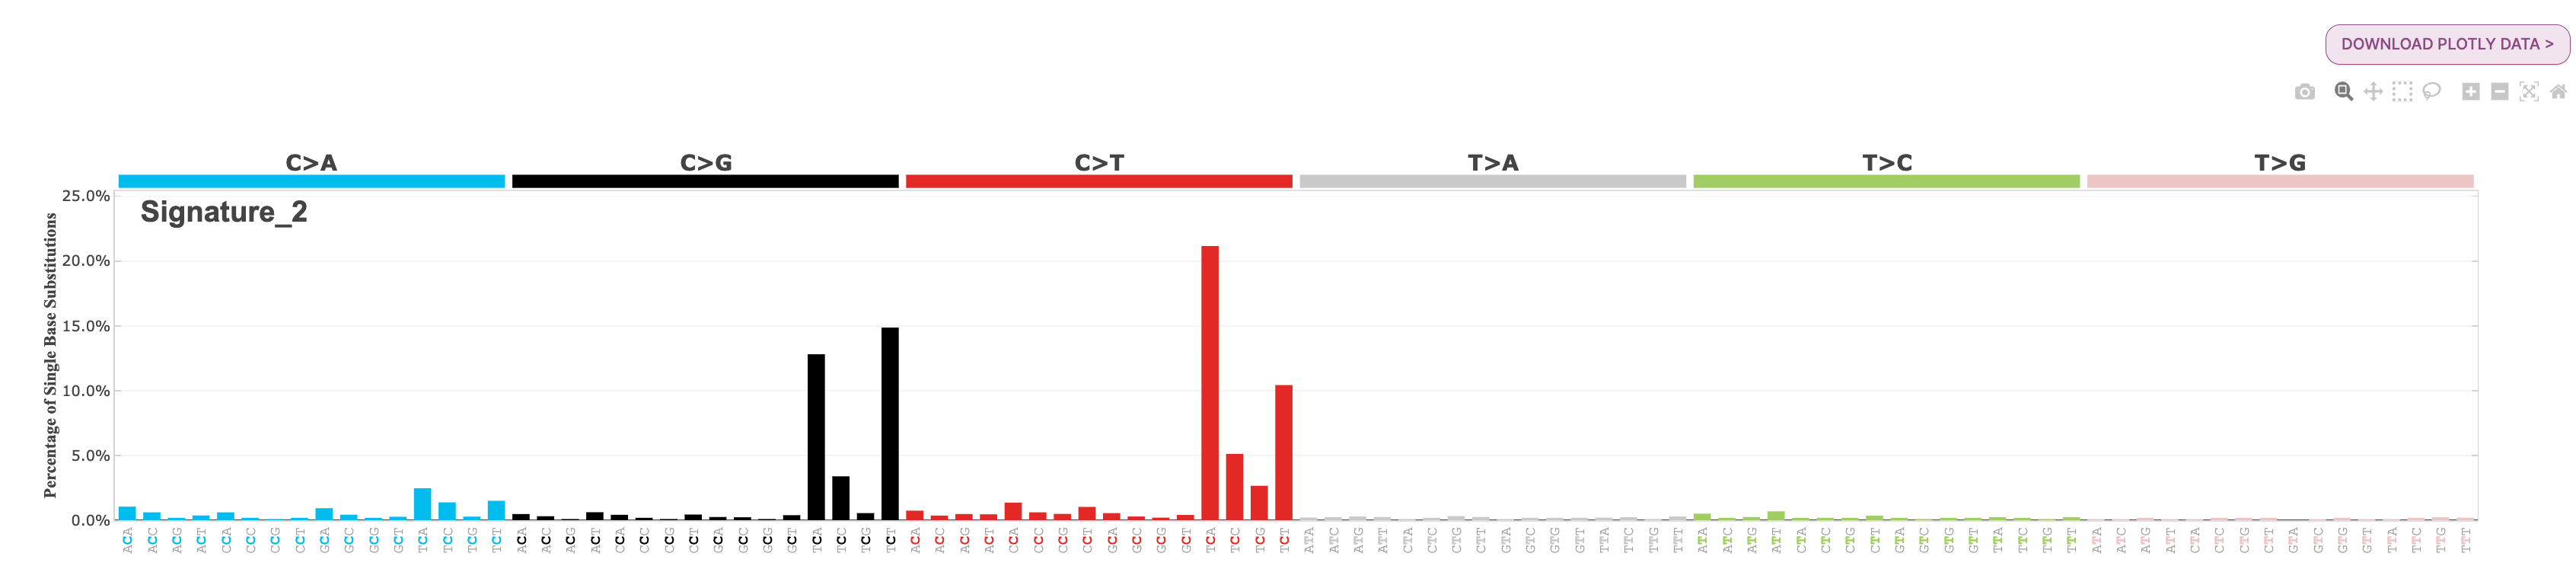
33. Click Add Plot in the bottom right of the page. In the second input set that appears, set the following input parameters for SBS13 (the only difference from step 19 is the signature name). You will see the following signature profile for SBS13:

We can see that these mutational profiles are rather similar in the earlier versions of COSMIC. SBS2 and SBS13 had not been completely separated from one another as two distinct signatures until Cosmic v3.
34. To check this, you can add two more plots to the current page. Click Add Plot to add SBS2 from Cosmic v3.

35. Click Add Plot to add SBS13 from Cosmic v3.

You will see that Cosmic v1 and Cosmic v3 versions of SBS2 and SBS13 are clearly different from one another, with SBS2 and SB13 becoming two separate signatures in Cosmic v3.
RS Comparison
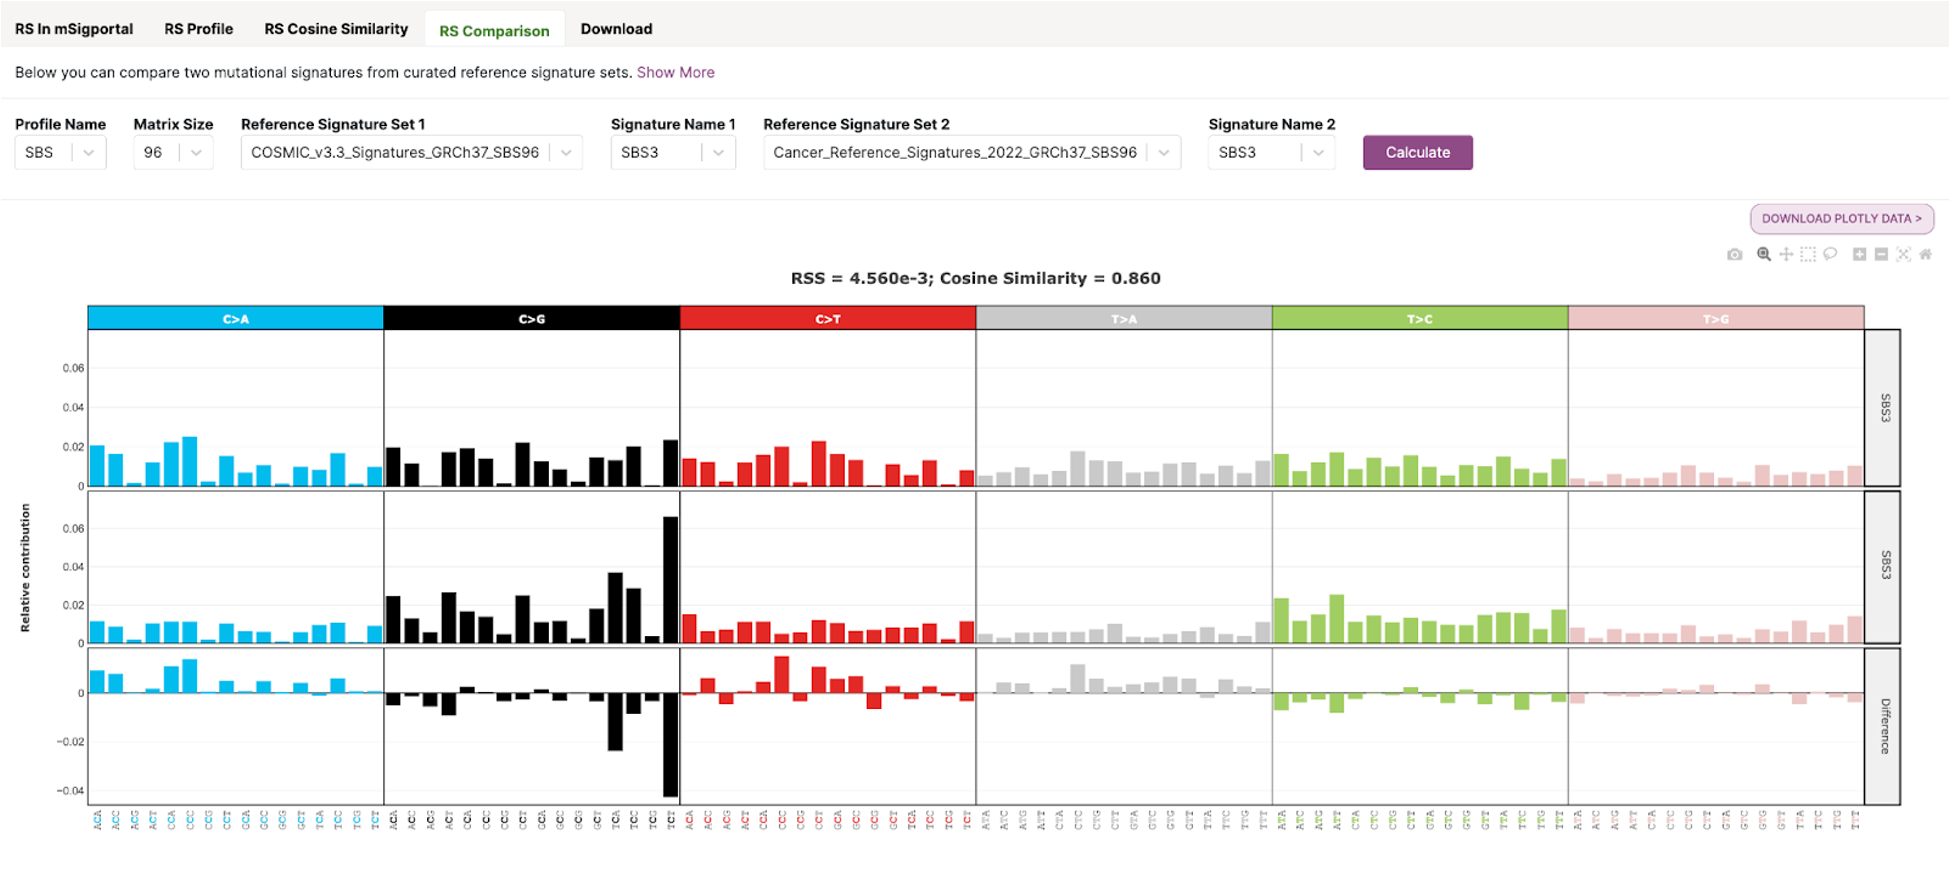
36. Click the RS Comparison tab at the top of the page. We are going to compare SBS4 from Cosmic v3.3 and Benzo[a]pyrene-diol epoxide (BPDE) 0.125 uM SBS signatures. Set the following input parameters and click Calculate:


You should see a plot that looks like this:
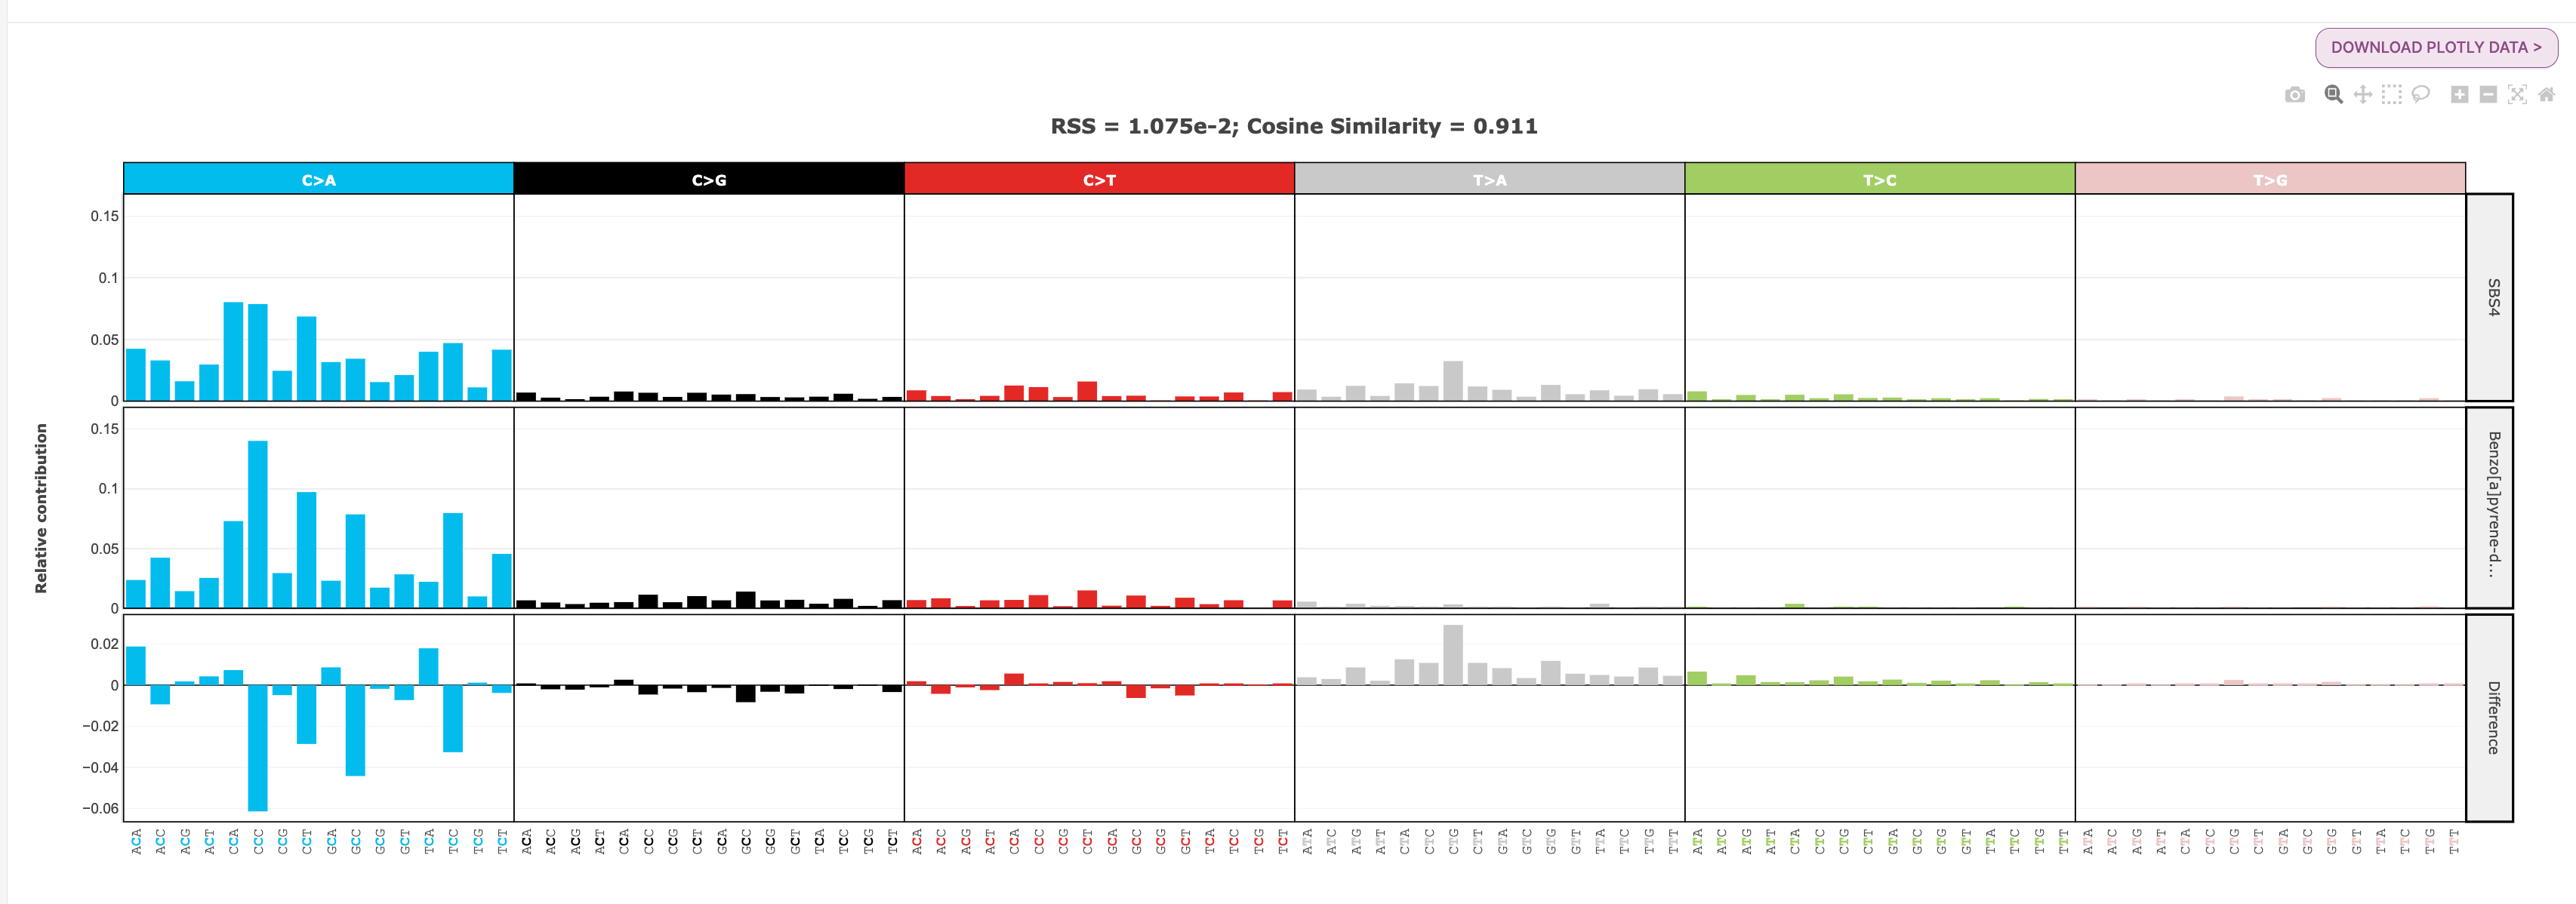
In this plot you will see three different SBS96 profile plots. The first signature input (SBS4) is in the top row, the second signature input (Benzo[a]pyrene-diol epoxide 0.125 uM) is in the second row, and the difference between them is in the bottom row.
At the top of the plot, you will see a measure for RSS and cosine similarity. RSS is the Residual Sum of Squares, and measures the discrepancy between two mutational profiles. Cosine similarity measures how similar two mutational profiles are. Two identical signatures will have a RSS of 0 and cosine similarity of 1. In our case, the small RSS value (1.075e-02) and cosine similarity value close to 1 (0.911) tells us that these two signatures are very similar to one another.
Explore and identify signature features (mSigPortal Visualization)
The mSigPortal Visualization module allows for interactive visualization and analysis of mutational profiles at the sample level from both user input as well as collected cancer genomic studies from scientific literature. It allows users to perform a wide range of analyses including cosine similarity, enrichment analysis, mutational profile comparison, and principal components analysis for all different types of mutational profiles.
Today, we will be using the demo user data included in mSigPortal.
37. Click the Visualization tab that is just to the right of the Catalog tab in the banner at the top of the mSigPortal page.

Across the top of the page you will see several different tabs that you can explore for different visualizations under this main module banner. Then, make sure that you are on the Instructions page (top left corner). Your window should look like this:

38. Switch the Data Source in the input box on the left of User.
Under Upload File, practice uploading the data yourself. Click Load Example Data to upload the demo data file. You should see the file name demo_input_multi.vcf.gz appear in the file input box. This is the input you need to update. See below.
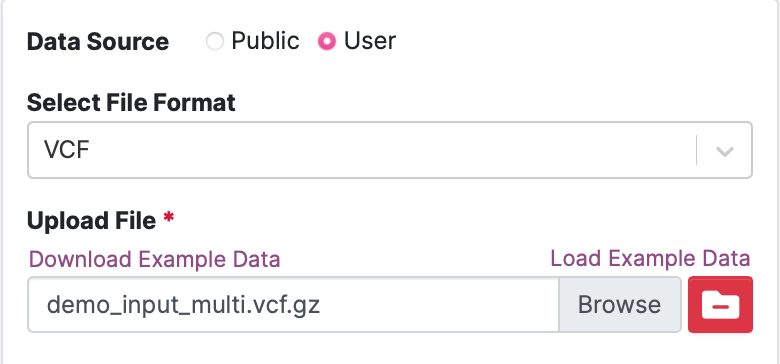
Click Submit.
Profiler Summary
40. After you click submit the results will load and you will automatically be taken to the Profiler Summary tab. Below is the plot you will see here:
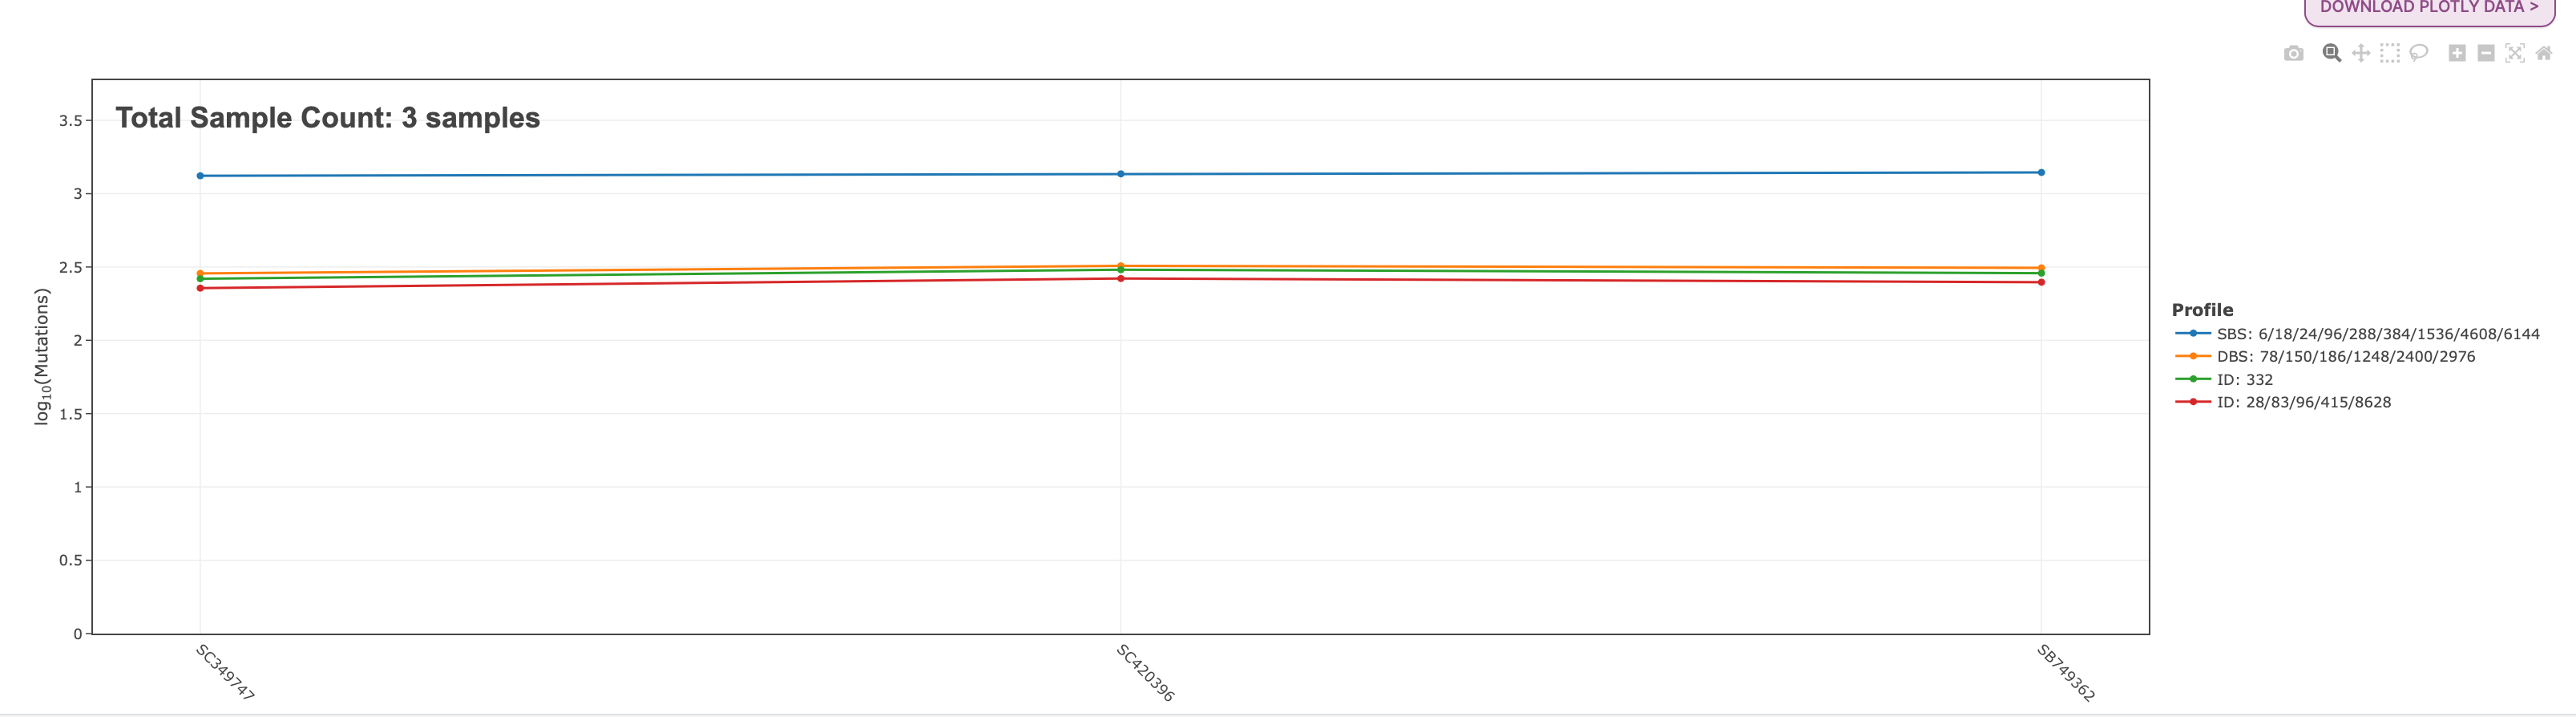
Across the bottom of the plot you will see each sample name that was included in the example input file. The y-axis is the log10(Mutations) count per each mutational profile. The legend for these profiles found on the plot are on the right of the plot. From this plot we can see that the SBS mutational profile contains the greatest amount of mutations across these three samples, and the other mutational profiles are all around the same value.
Mutational Profiles
41. Now we will briefly look at the Mutational Profiles tab. In Mutational Profiles, users can select a sample, name, the profile type, matrix size, and filters if applicable.
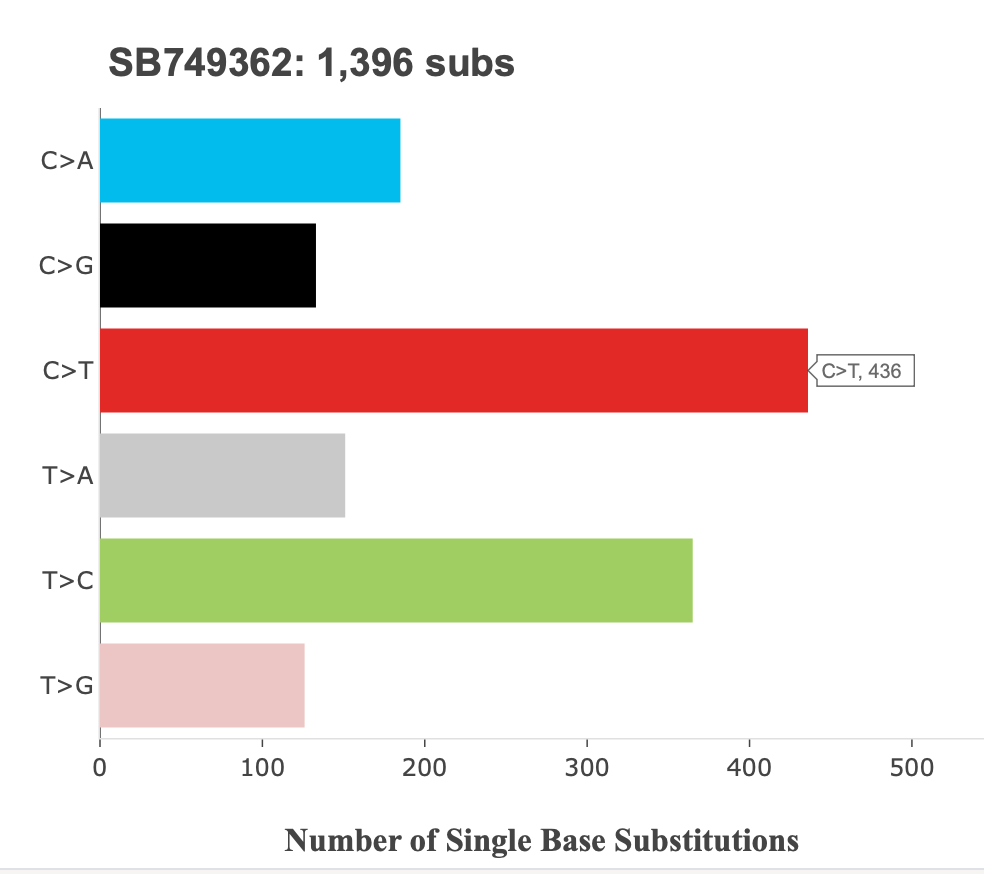
42. If you click the Sample Name dropdown, you will see the same three samples that were on the Profiler Summary plot. For our purposes today, set the sample name to SB749362, and the profile type to SBS. For any of the plots here, note that they are interactive. Users can hover over the different bars on each plot mutation types and contexts, as well as the count of the type or context.
The first matrix size is 6. Here we see the sample name and the total number of substitutions across the top of the plot, and the six mutation classes, each with their own bar. The C>T mutation class is highlighted, and we can see there are 436 mutations of this class:
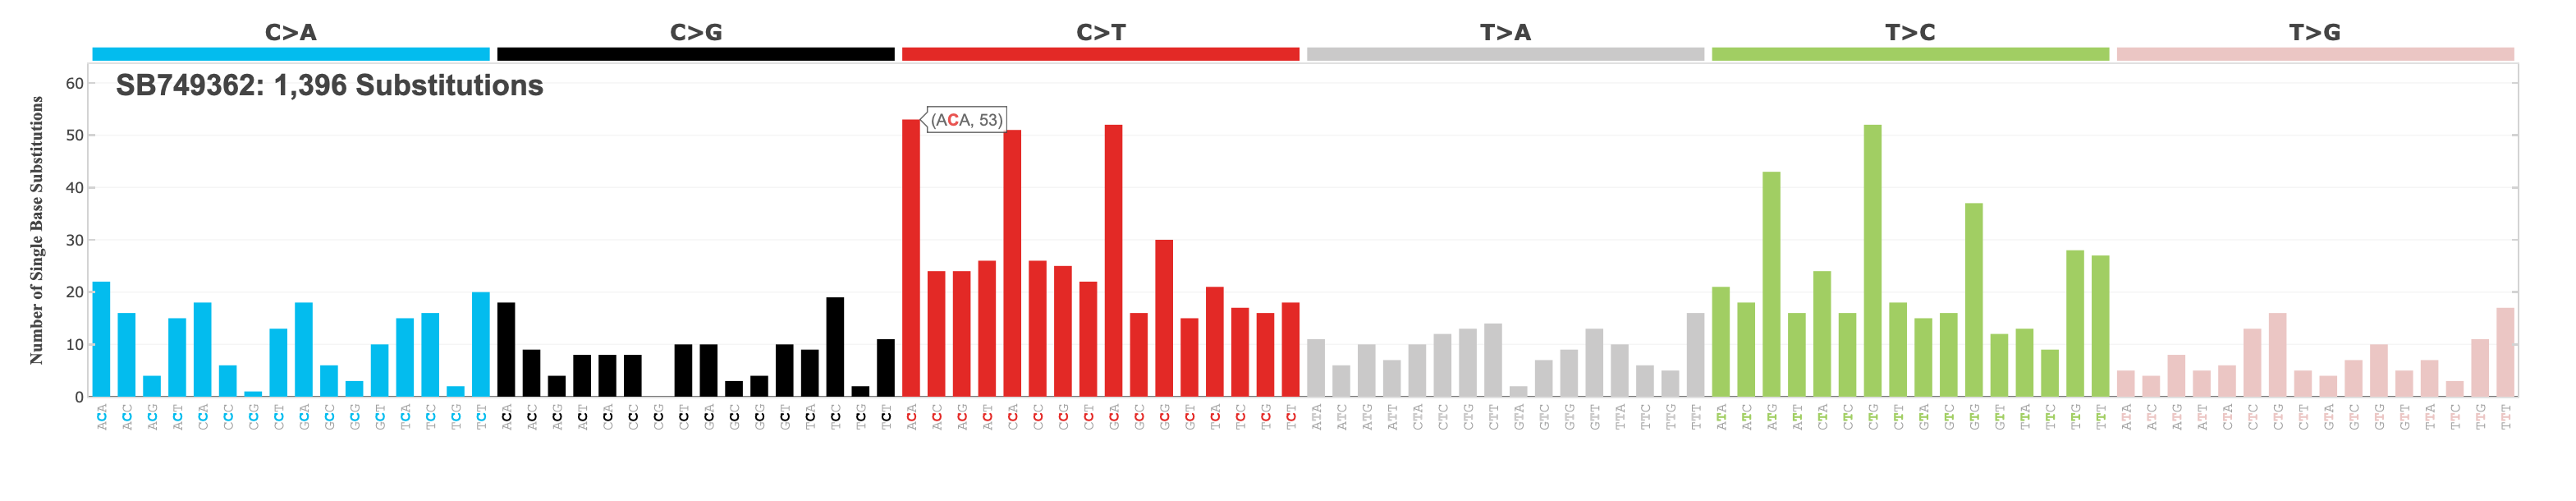
Feel free to explore the other matrix size options for SBS. The traditional SBS profile matrix size is 96, which you can see here, with the ACA mutation context selected to illustrate the interactive component of the plot:
Explore mutational signature activity of public data (mSigPortal Exploration)
The mSigPortal Exploration module allows users to systematically explore the mutational signature activities and performance of the mutational signature decomposition from user input, or collected public genomic studies (TCGA, PCAWG, Sherlock-Lung, etc.). This module allows users to perform analyses with mutational signature patterns and integratively explore the activities of each mutational signature including visualizations of tumor mutational burden, signature decomposition performance, mutational signature associations, sample clustering by mutational signatures, prevalence of single mutational signatures, and decomposition of mutational signatures in individual samples.
43. Select the Exploration tab from the banner at the top of the page:

You should now see a page like this:

44. We are going to use the Sherlock study for this demonstration. Select the following inputs as seen below:
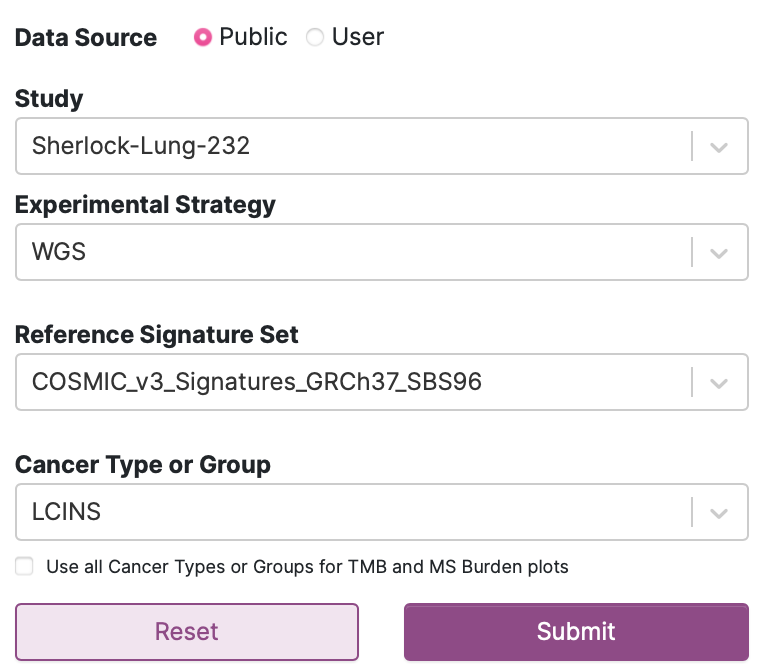
When your inputs match those above, click Submit.
TMB
45. You will automatically be taken to the TMB tab when the results are loaded. Below is the plot you should see for TMB in the Sherlock-Lung-232 study.
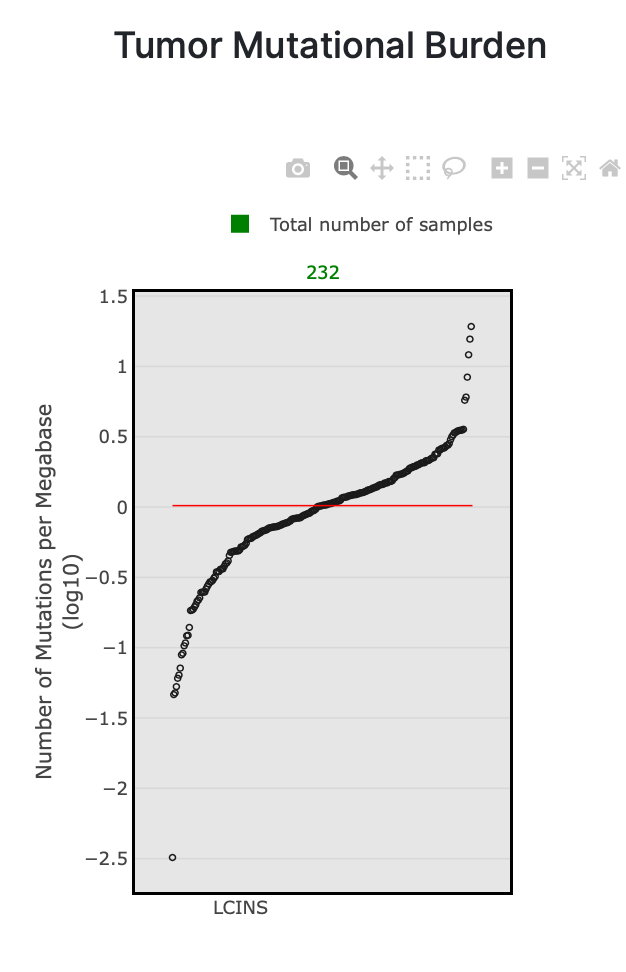
As you can see in the plot, each dot is a sample in the study. In this case, these are samples of lung cancer in never smokers (LCINS). The x-axis includes all 232 samples (noted in green at the top of the plot), and the y-axis is the number of mutations per megabase (log10). The red line is the median number of mutations per megabase.
The TMB plots in mSigPortal are also interactive. You can hover over each dot on the plot to display additional sample information. In the screenshot below, the sample selected has about 1.3 mutations per megabase.
TMB Signatures
46. Select the TMB Signatures tab.
Now the Sherlock samples are separated by mutational signature. In the plot below, there are several different signatures across the bottom, and as in the last plot, the number of mutations per megabase (log10) on the y-axis. Per the legend at the top of the plot, the green numbers along the top of the plot denote the number of samples, while the blue numbers denote the number of samples in which the signature was detected.
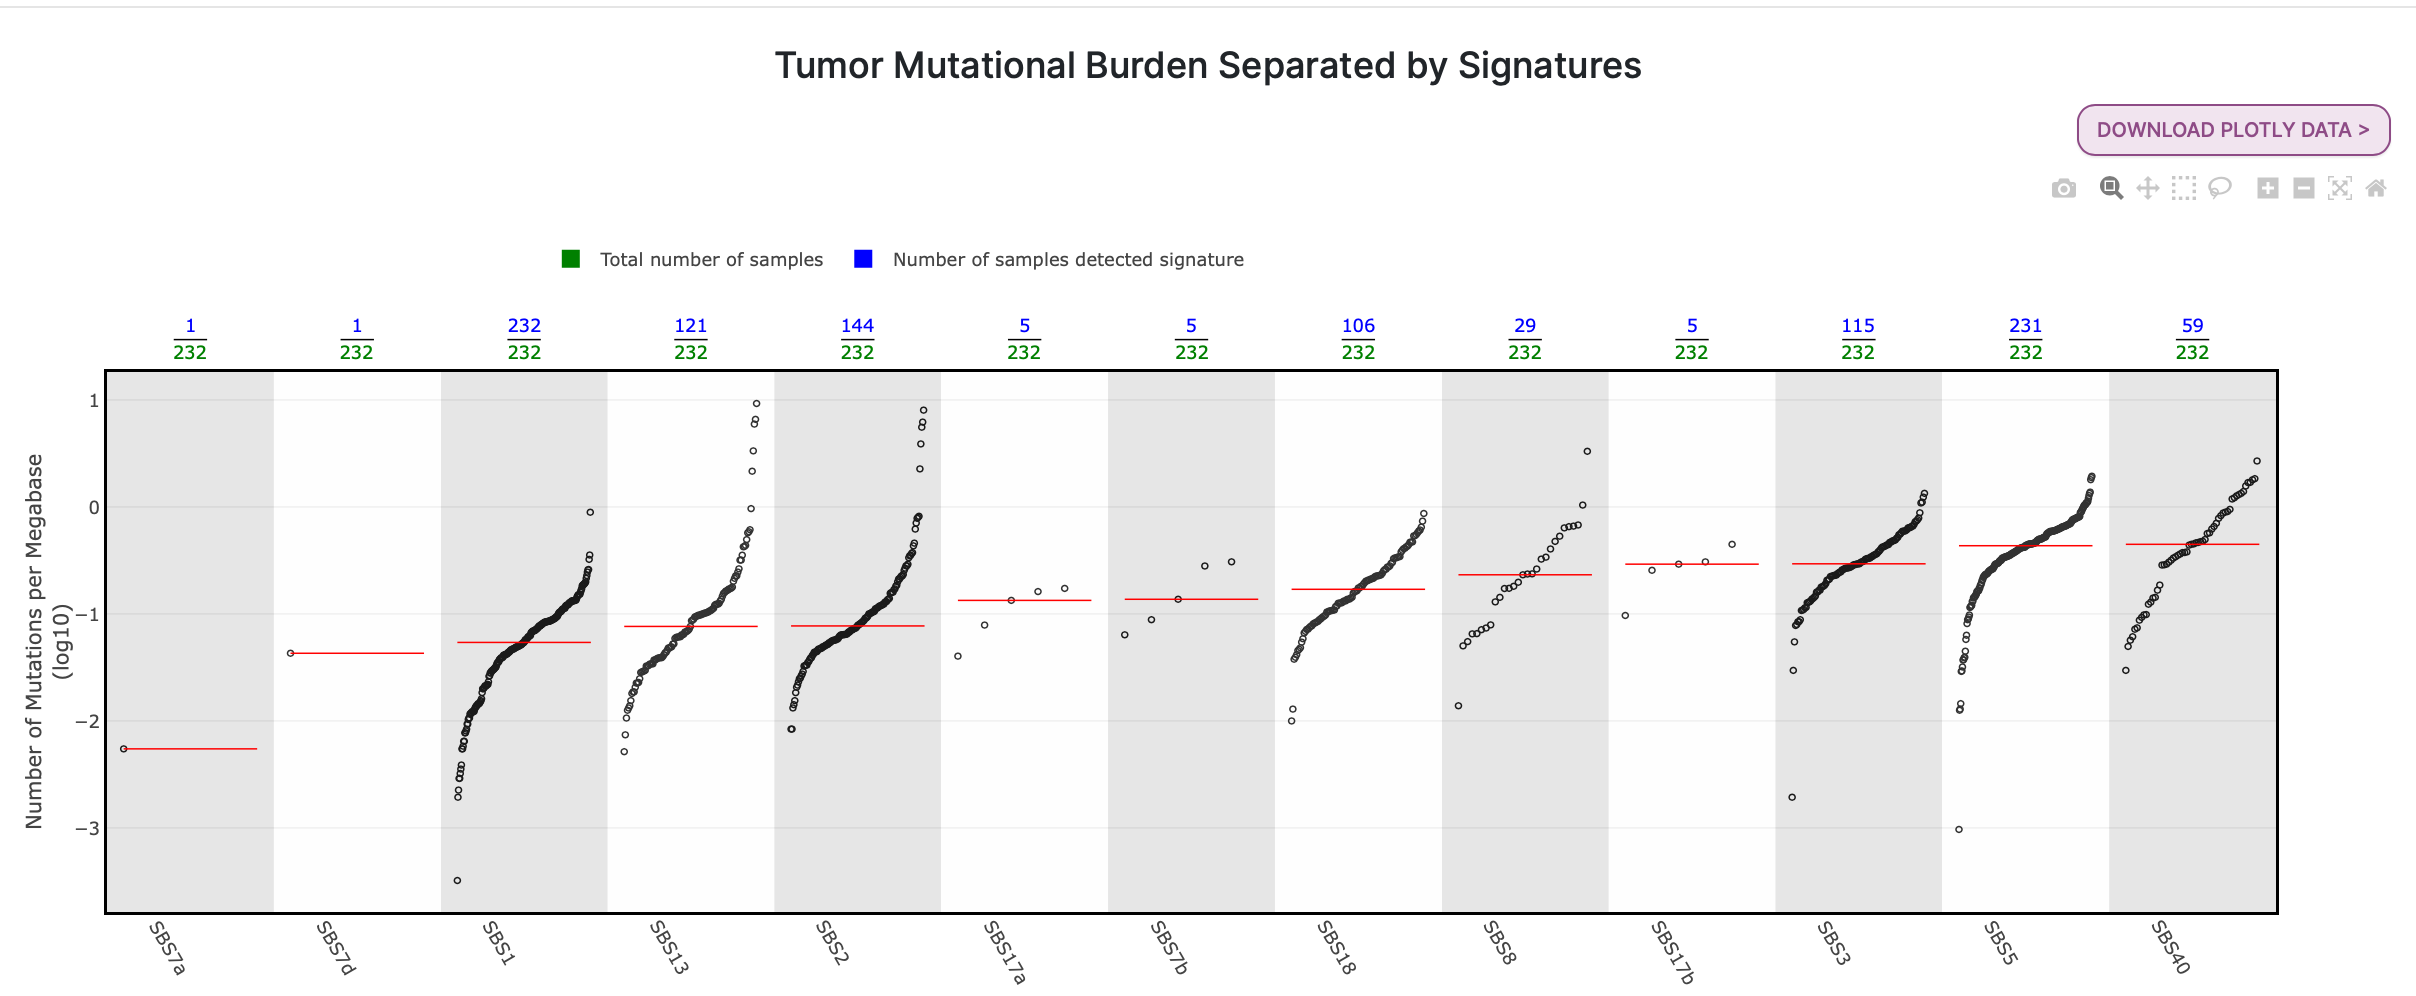
Question: Which signature was detected in all 232 samples? What is the proposed etiology of this signature? (Hint: We talked about this signature and its etiology in one of our first questions while exploring mSigPortal Catalog.)
Answer
SBS1 was detected in all 232 samples. The proposed etiology of SBS1 is the spontaneous deamination of 5-methylcytosine. SBS1 is a clock-like signature, meaning that the number of mutations corresponding to this signature increases as an individual ages.
MS Prevalence
47. Select the MS Prevalence tab.
The final section we are going to look at for the Sherlock samples is MS Prevalence, or mutational signature prevalence. You can see that there are two plots, signature prevalence by mutations (pie chart) and signature prevalence by samples (bar plot). The colors in the pie chart correspond to the signature in the bar plot with the same color.
The plots you see here are based on a minimum of 100 mutations required for the detection of the signature in a sample. This can be changed and the plots will adjust accordingly.

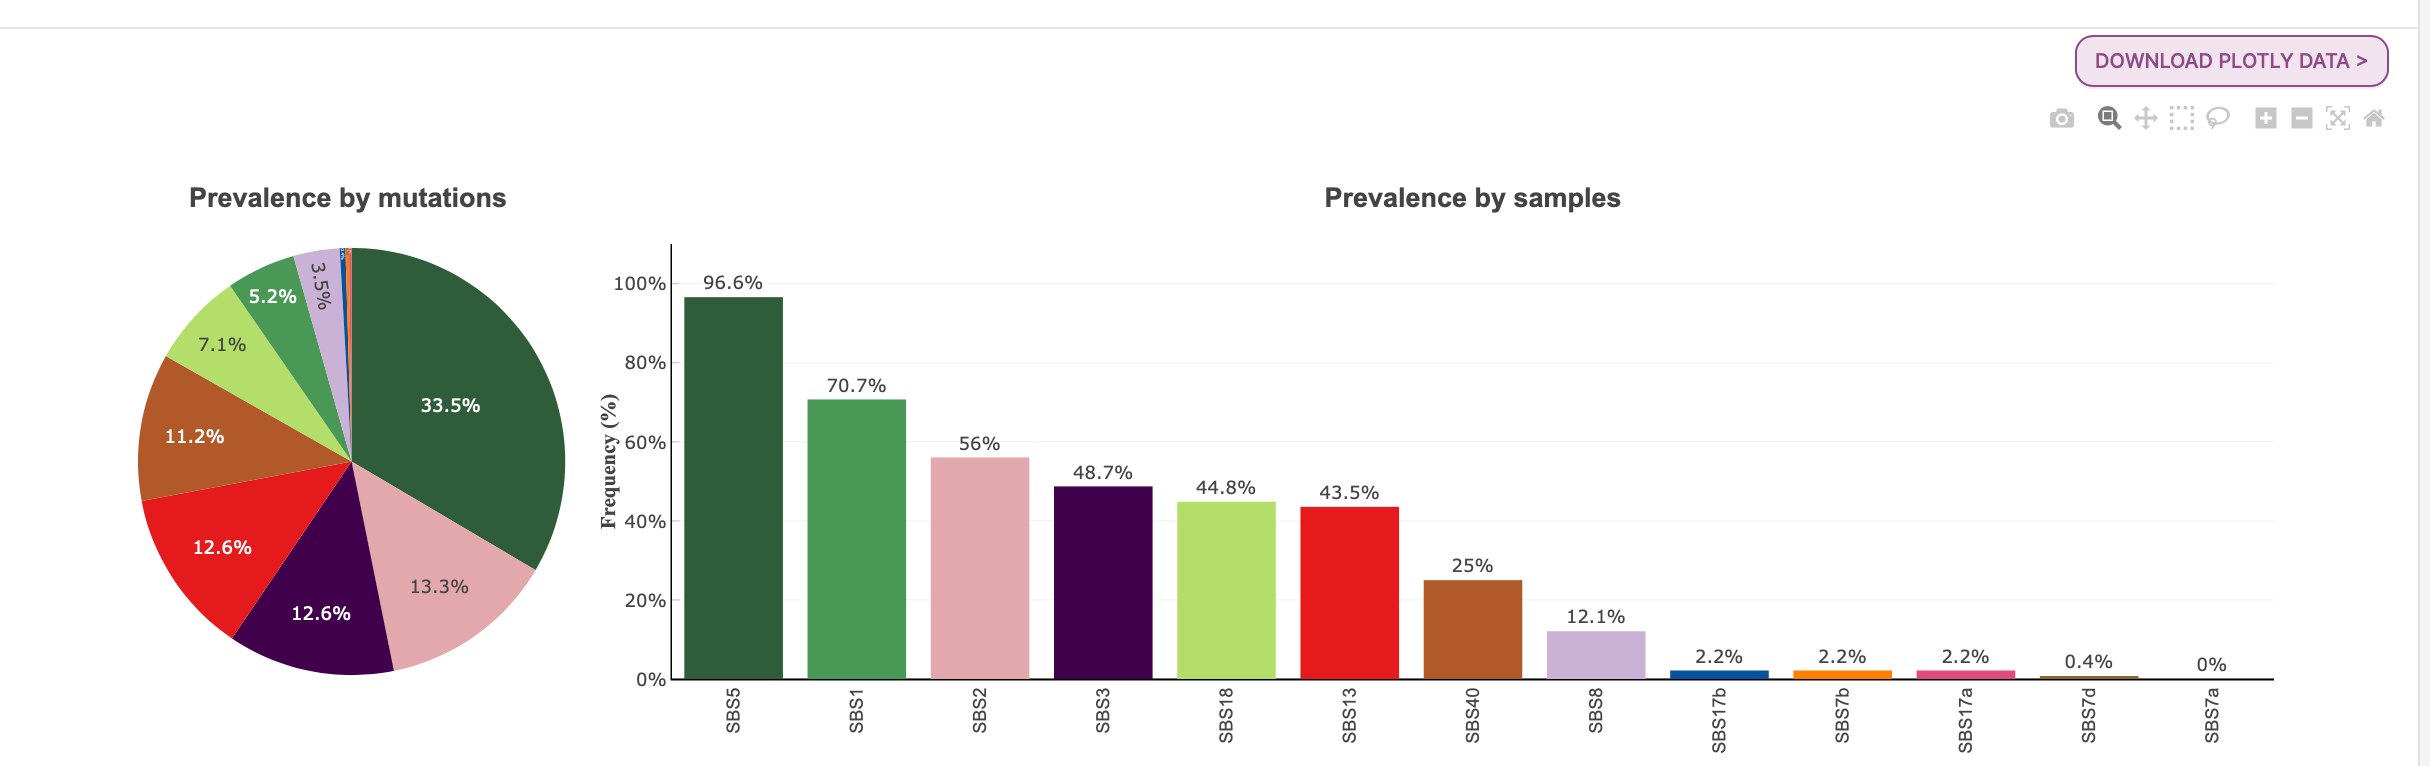
We can see that at a minimum of 100 mutations, in the prevalence by samples plot, about 97% of samples had at least 100 mutations assigned to the SBS5 signature. In the prevalence by mutations pie chart, we see that 33.5% of the total mutations were assigned to SBS5.
Question: Practice changing the minimum number of mutations input to see how the bar plot changes according to the minimum number of mutations.
Answer
Here are a couple of examples when changing the minimum number or mutations:


Generally, we can see that the frequency bars for each signature increase when decreasing the minimum number of mutations, and decrease when increasing the minimum number of mutations.
Signal PanCancer (Explore)
Signal contains mutational signature data for cancer samples as well as chemical mutagens and genes via gene knockout experiments. Specifically, it includes data from a study analyzing over 3,000 samples from mostly ICGC’s PCAWG dataset of whole genome sequenced cancers (Degasperi, 2020), as well as data from more than 18,000 whole genome sequence cancer samples in the Genomics England 100,000 Genomes Project, the Hartwig Medical Foundation, and ICGC’s PCAWG dataset (Degasperi, 2022).
Note: It is important to note that the mutational signature profiles you see here are not identical to the mutational signature profiles found in COSMIC, even though the signature names are the same. The sample sets of COSMIC and those in Signal differ from one another, as well as the methodologies used for signature analysis. For example, SBS3 in COSMIC and SBS3 in Signal are very different from one another. In COSMIC, SBS3 is a “flat” signature, whereas SBS3 has a peak in C>G mutations in Signal:
COSMIC:
Signal:
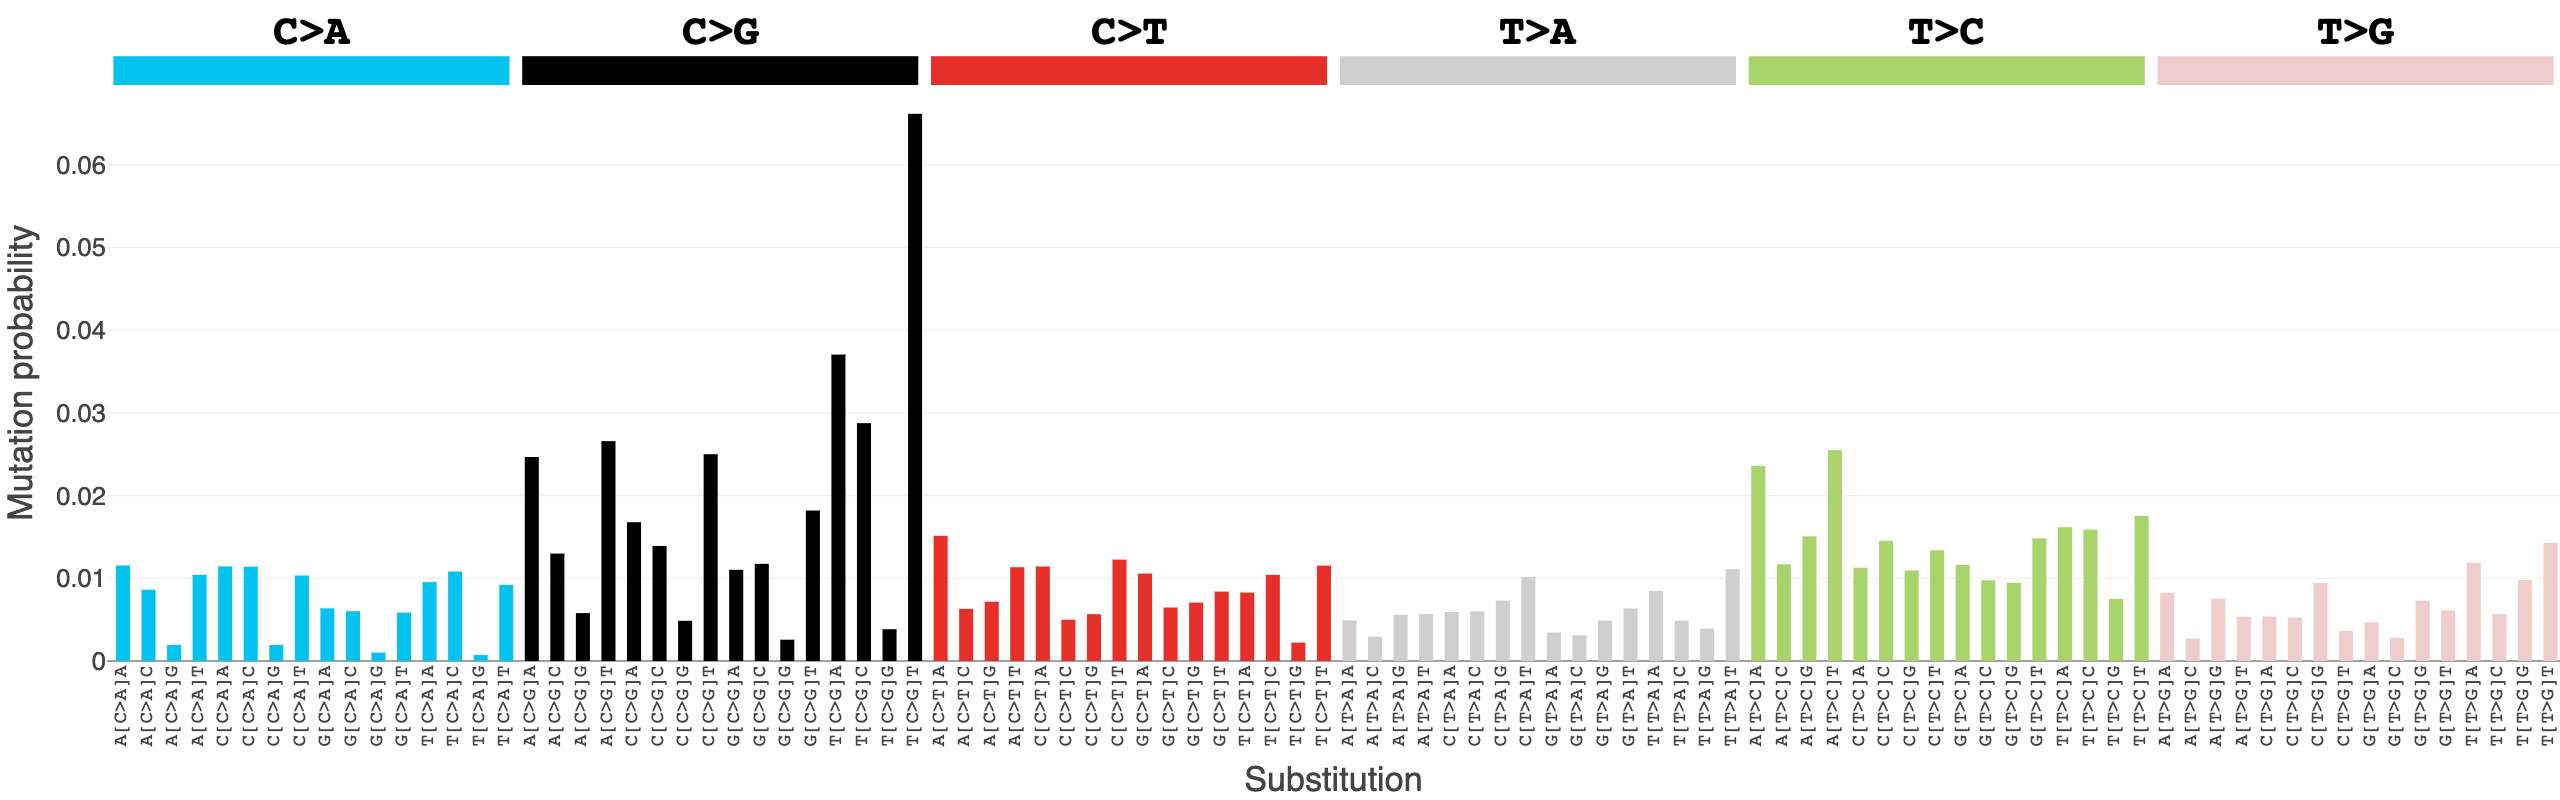
You can also use mSigPortal to calculate the cosine similarity of these two profiles!
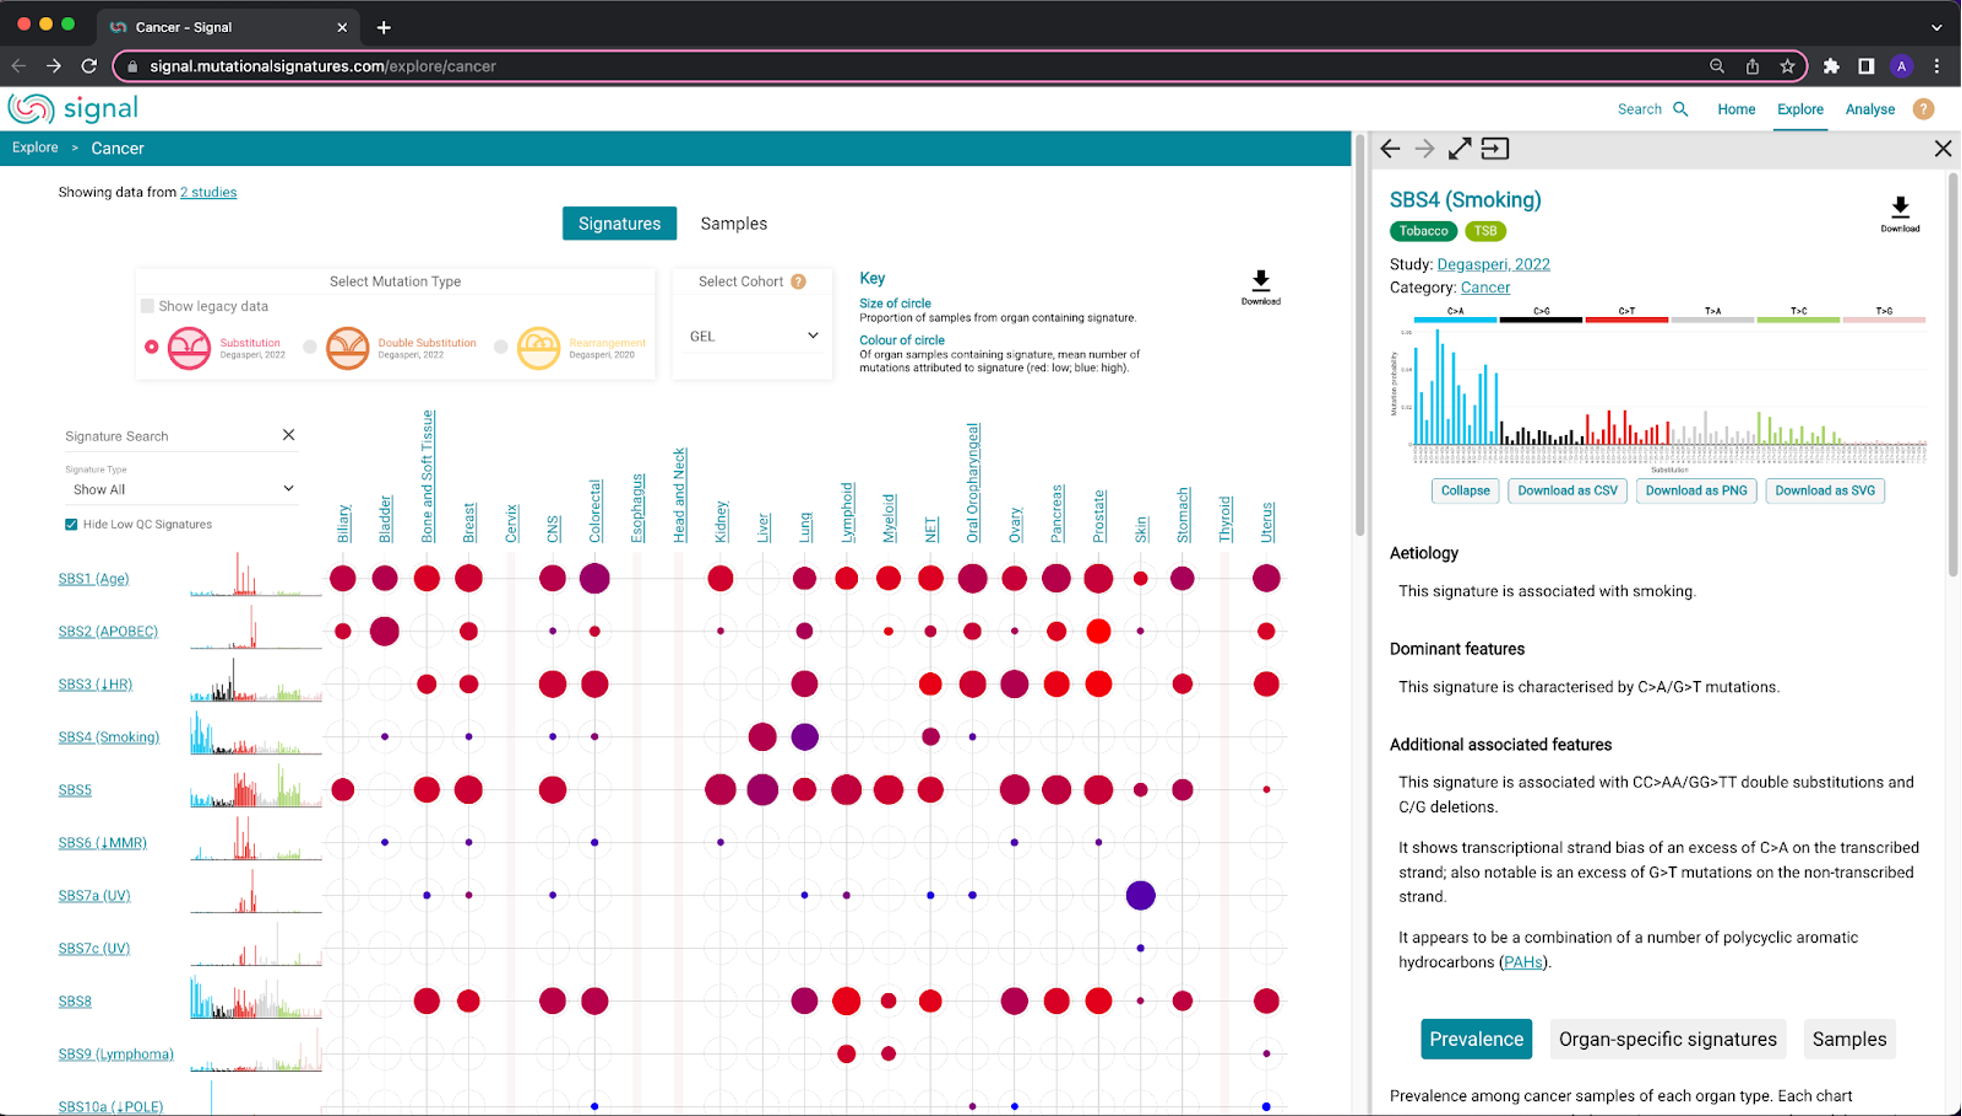
48. We are going to quickly show you the Signal website, specifically the Explore tab. Click the following link: https://signal.mutationalsignatures.com/explore/cancer.
49. This will bring you to a Signatures summary page, which shows different organs along the top of the plot and mutational signatures along the left side of the page. The size of the circles throughout the plot correspond to the proportion of samples from the organ containing the signatures. The color of the circle corresponds to the mean number of mutations attributed to the signature, based on the number of organ samples containing the signature (red: low ; blue: high).
If we look at SBS4 for example, we can see that it occurs in several different cancer types, but mostly in the lung and liver. In addition, since the coloration of the lung circle is closer to blue, it has a higher mean number of mutations attributed to the signature compared to the liver.
50. If you hover over the signature name or any of the dots in the plot, you can open them in a sidebar:

Try this yourself with SBS22, which was discussed earlier and is associated with aristolochic acid exposure.